Chapter 4—Debugging Methods
You add variables and methods to the classes and objects in your library using the Method Editor which includes a free-type Code Editor to allow you to write Omnis code faster and more easily.
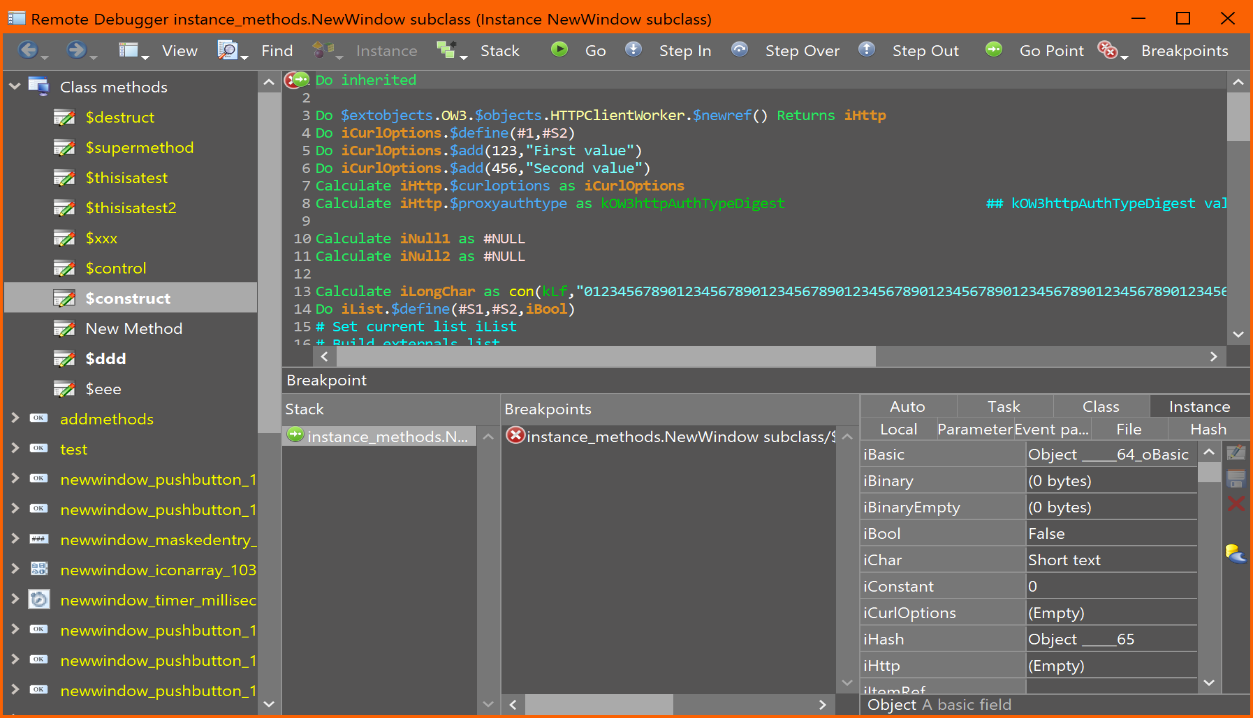
You can debug the methods and step through the code in your library using the Omnis Debugger, which is an integral part of the method editor, plus you can debug your Omnis code remotely over a network using the Remote Debugger.
The Omnis debugger provides several tools to help you monitor the execution of a method, including the ability to create watch variables, interrogate and edit the contents of variables during execution, and place a variety of breakpoint conditions, which when met will interrupt execution.
The debugger operations are controlled from the Debug and Options menus on the method editor menubar. The debug options are also on the toolbar, which you can show using the View>>Toolbar menu option. The hierarchy of methods calling other methods is saved in the method stack and shown on the Stack menu.
You can also check your code using the Method Checker, available under the Tools menu and described in this chapter.
Note that most of the example code in this chapter is generic and can be applied to all programming tasks; however, some of the example code may relate to window classes only, but the code may be easily adapted to work with remote forms.
Method Editor
The Method Editor is the main tool you use for programming or coding in Omnis Studio. Using the Method Editor and Debugger, you can:
Insert and Edit methods using the Code Editor and Code Assistant
Run and step through methods using the Debugger
Set Go points and Breakpoints
Trace the execution of method lines and field values
View and alter fields and variables
Inspect the method stack
Debug your live code, sending commands to the Trace log
Debug your code remotely on your live app server: see Remote Debugger
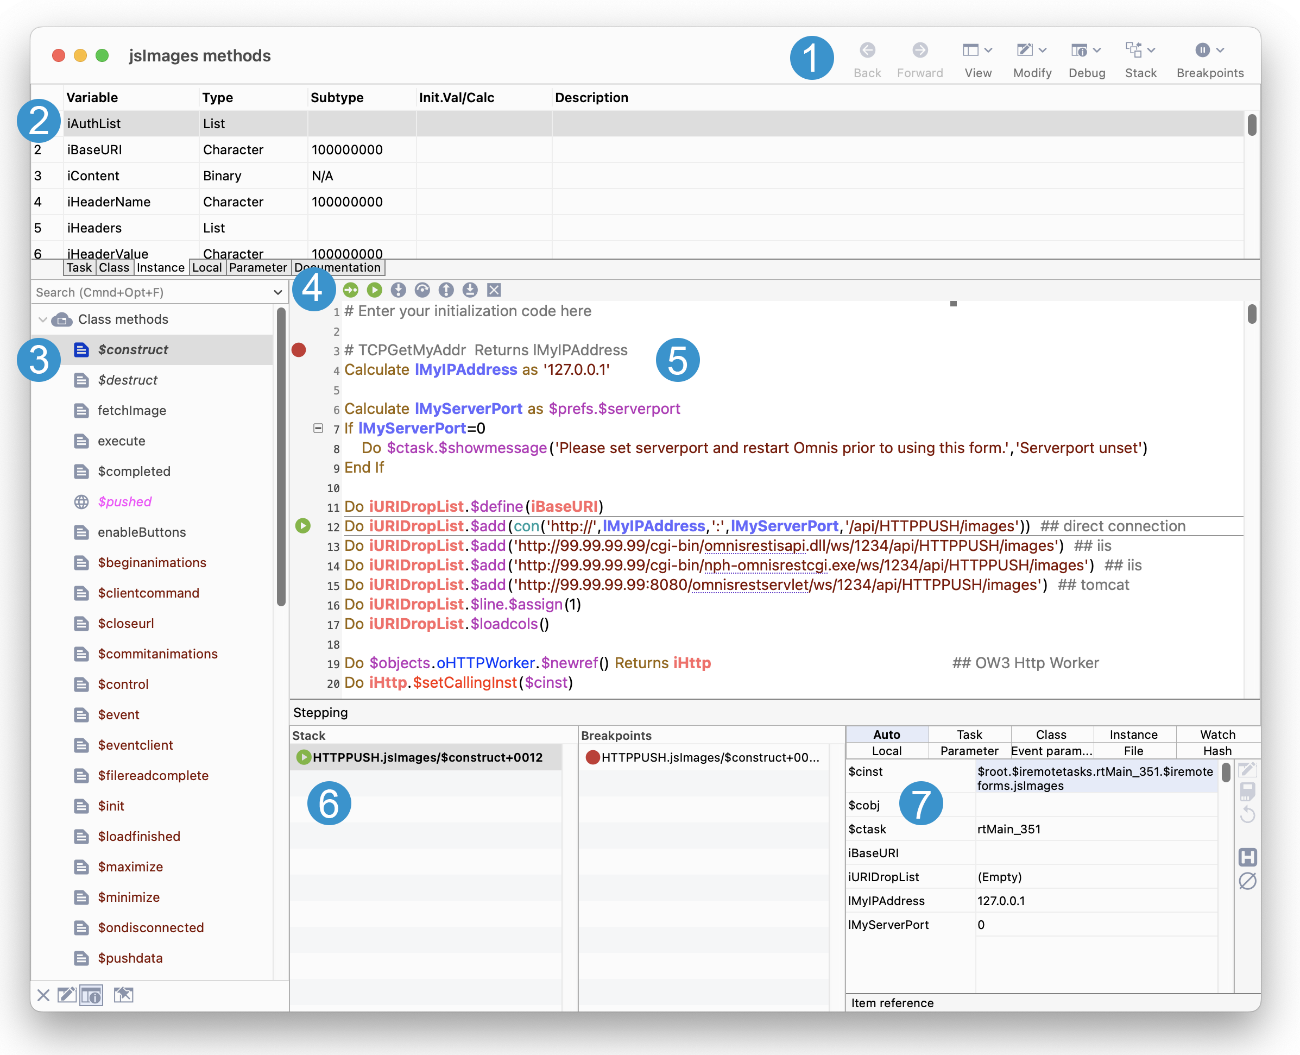
The Method Editor has several different areas, each doing a different job, as described below.
1. Toolbar
the main toolbar gives you access to the View, Modify, Debug, Stack and Breakpoints menus; many of the options in these menus have keyboard equivalents to give you hands-free coding. The Back and Forward options let you jump back to or from called methods as you step through code.
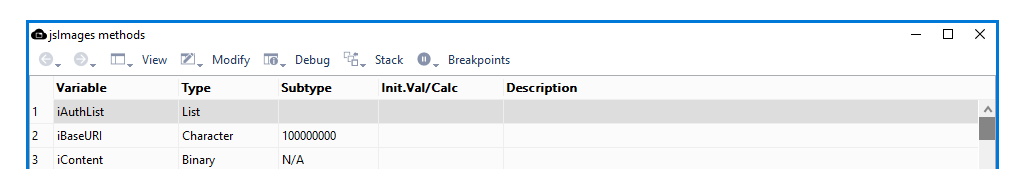
On macOS the toolbar appears in the window title bar on the right (as above), but on Windows it appears under the window title on the left (see below); this is the only visual difference, but in all other cases the appearance and functionality is the same on macOS and Windows
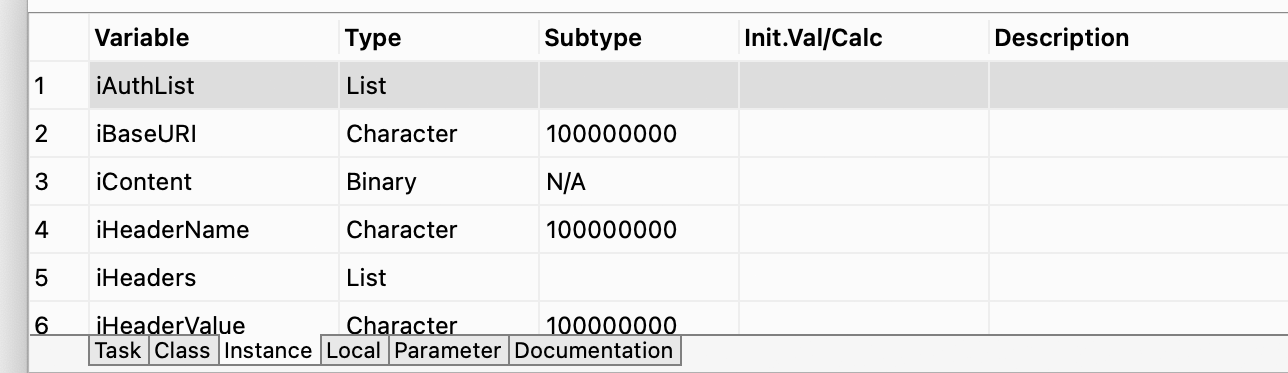
2. Variables pane
lets you add variables to the class or method, including task, class, instance, local, or parameter variables; you can hover over a variable to see its value (if available), or you can Right-click on a variable to set other option. You have to Right-click on blank space in the list or in the left margin to insert a New Variable
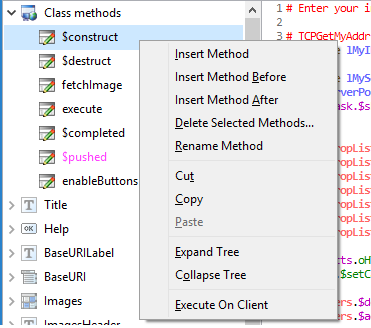
3. Method list or Method name list
lists existing methods for the class or object, or lets you add methods to the object,: the method tree list shows the methods for the class under Class Methods, or for UI classes it also shows the methods for the individual controls or fields in the class, listed after the class methods. You can Right-click on the method tree list to insert a new method, delete or rename a method, Cut or Copy a method, or Expand/Collapse the entire method tree. When the focus is on a method name in the method editor tree, pressing Return or Enter lets you edit the method name
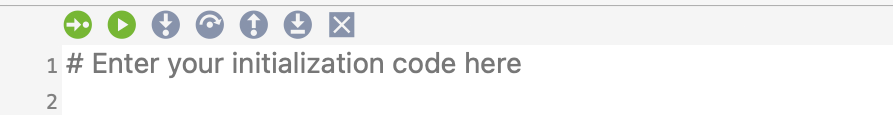
4. Debug toolbar
appears at the top of the Code Editor panel allowing you to Set the Go point, Go (execute the method), Step in, Step over, Step out, Step To Line, and Clear the method stack
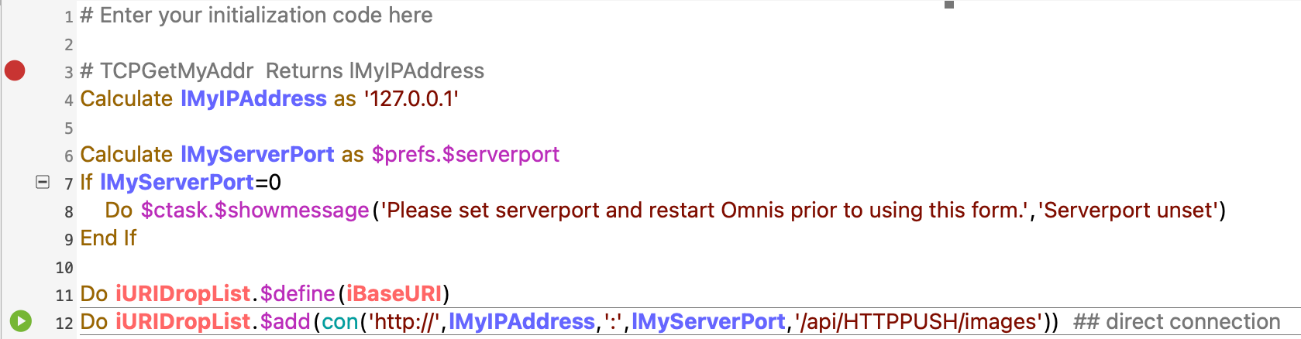
5. Code Editor
lets you add the code for a method, or view and edit the code for an existing method: there is a Help panel, at the bottom of the code editor pane, showing the syntax for the current selected Omnis command: see below for a complete description of the Code Editor and Code Assistant
6. Debugging and Breakpoint panels
this area displays the Method stack and list of Breakpoints currently set, which are redrawn dynamically as you debug and step through your code and jump from one method to another
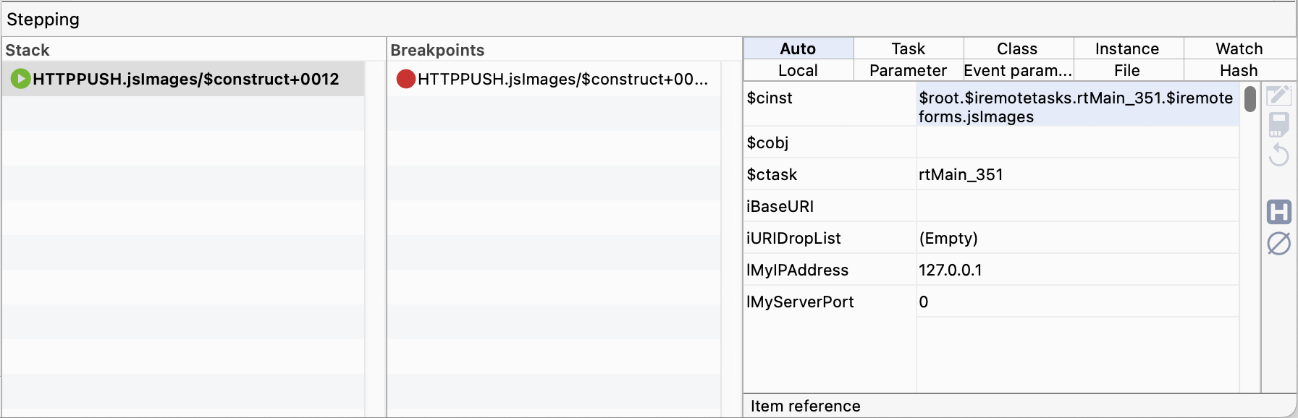
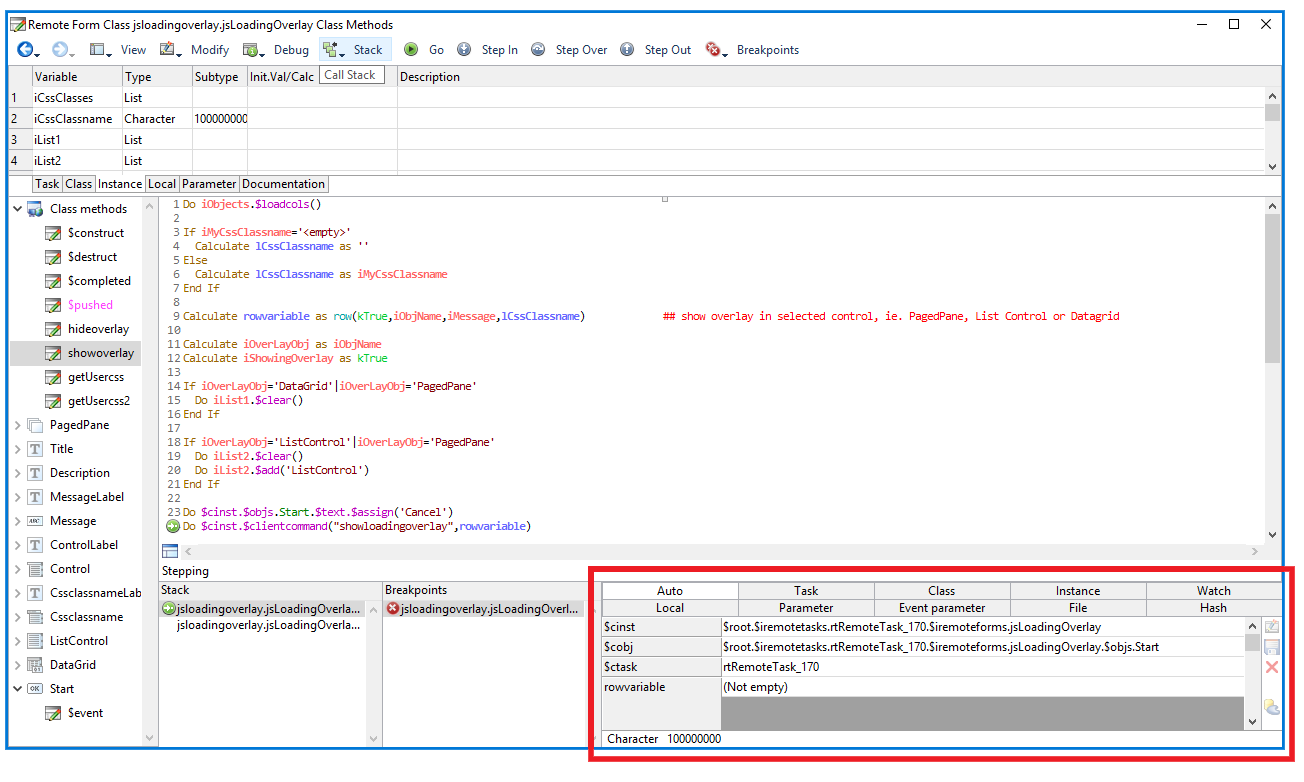
7. Variable panel
The Variable panel (on the right, see above) allows you to view and modify variables while you debug and step through your code; as execution pauses, it displays the current values of all the variables, as well as the Watched variables, and you can drill down into the hierarchy of objects and variables
Opening the Method Editor
You can open the method editor in a number of ways, depending on the type of object you’re working on and where you are in Omnis.
To open the method editor for a class
Open your library and view its classes in the Studio Browser
Right-click on the class in the Studio Browser list
Select the Class Methods option from the context menu
To open the method editor for a Remote Form
Or you can
Or you can
- Double-click on the background of the Remote Form to open the Method Editor for the class
To open the method editor for a Report
For a Report class (or window, menu, and toolbar classes) you can:
Open the report editor for the class (or window, menu, or toolbar editor) from the Studio Browser
Right-click on the background of the class design screen
Select the Class Methods option from the context menu
To open the method editor for a field or object
Open the remote form class (or window) from the Studio Browser
Double-click on the field or object to open the Method Editor
Or
Right-click on the field or object, e.g. a button
Select the Field Methods option from the context menu
Task, remote task, table, remote object, object and code classes can only contain methods, so when you modify (double-click) these classes you go straight into the method editor.
Inserting and Editing Methods
You can insert, edit and debug the methods in your library using the Method Editor.
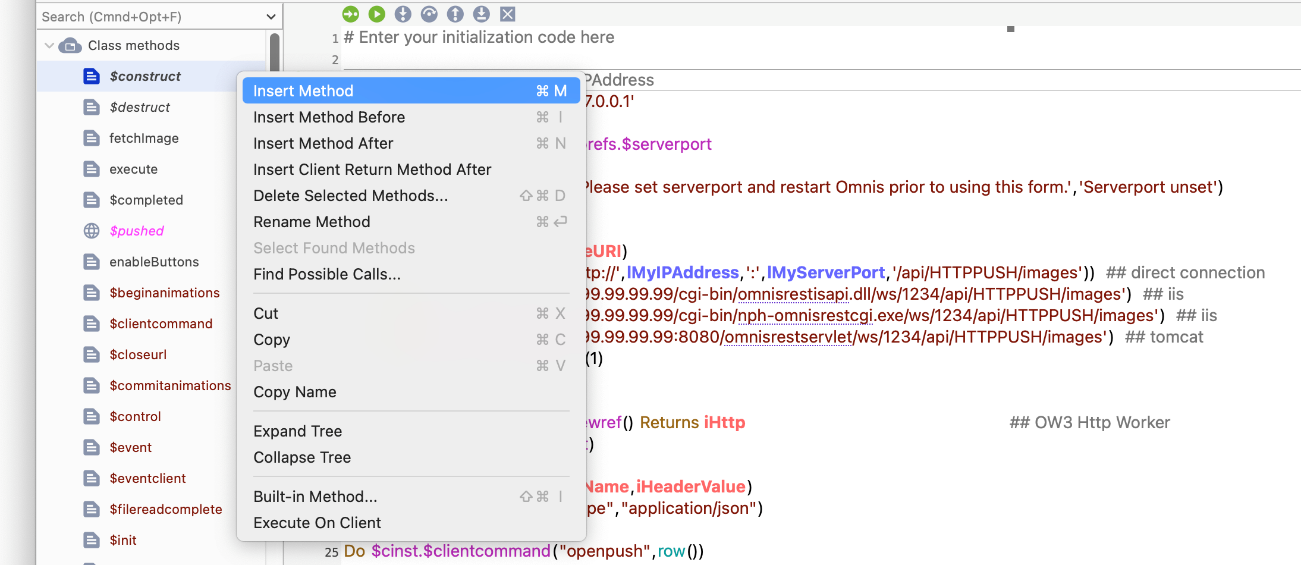
Inserting a Method
To insert a method
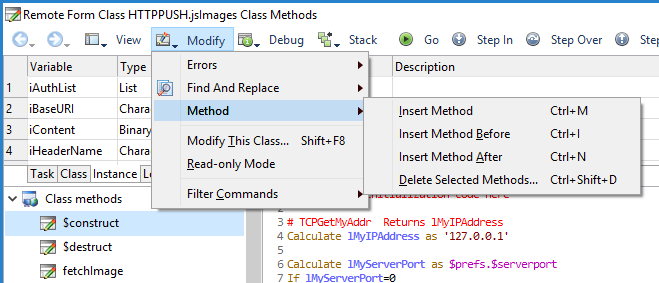
- Right-click on the method list and select Insert Method, Insert Method Before, or Insert Method After
or
- With the focus on a method in the Method list, click on the Modify menu in the method editor toolbar and select Insert New Method
or
- Press Ctrl/Cmnd-I while the focus is on the method list: this option inserts a method above the current one
When you have entered the new method name, you can begin to add the code for the method in the Code Editor on the right-hand side of the method editor.
Maximum Number of Methods
The maximum number of methods allowed per class is 4096 (the limit was 501 in versions prior to Studio 10.2).
Line Numbers
You can display a line number for each method line in the Code Editor. You can enable line numbers using the View menu.
Showing Inherited Methods First
The Show Inherited Methods First option in the View menu allows you to display inherited methods at the top of the methods list in the Code Editor; the option defaults to off which means inherited methods will be shown after all other methods at the bottom of the list.
In addition, the remote debug server configuration has a new option (Show inherited methods first in method lists) which controls the information returned by the server to the client, and therefore the display in the remote debug window. The remote debug server dialog has been updated to allow this option to be edited.
The F8 shortcut works for inherited methods. So if you press F8 on the code line Do $inherited.$test() it will load the $test method in the inherited class.
Showing Built-in Methods
The Show Built-in Methods option allows you to hide or show the built-in class methods. When enabled (the default), the class methods node in the method name list includes the Built-in methods for instances of the class type being edited, including $control, $construct, and $destruct, as well as any Control methods that can be overridden, including $event. This applies to Remote forms and Remote tasks (plus other classes that can be instantiated including window classes). In addition, $canclose will be shown for the relevant instance types, while $select and $fetch are shown for table classes. Many other methods could be shown depending on the class type, including $filereadcomplete, $init, $term, $sfsorder, $sfscanclose, $pushed, $sqldone, $suspended, $resumed, $loadfinished, $previewurlclicked, $pdfcomplete.
The Built-in and Control methods behave in a similar way to inherited methods, that is, you can override them, or set them back to using the default, by using "Built-in Method..." option from the menus (this is analogous to using Inherit Method... for an overridden inherited method). When you override a Built-in or Control method, Omnis pre-defines the parameters of the new method to match those required by the method.
The names of the Built-in or Control methods are shown in the tree using the no set property color (this is consistent with how built-in method names are drawn in the Interface Manager).
The "overriddenbuiltinmethodstyle" color theme member can be used to give the name of an overridden method a different text style when it is shown in the tree. This theme member is in the IDEmethodEditor group of the appearance.json file, and can have the same possible values as "overriddenmethodstyle"; it defaults to 2 (italic).
Overriding or Inheriting multiple methods
You can multi-select the methods from the Methods list or a single object and then override or inherit the methods, as appropriate, from the context menu or the Modify menu. If all selected methods are built-in or inherited, they can be overridden with a single override method command on the context menu, or the Modify menu.
If all selected methods override inherited methods, they can be deleted and re-inherited using a single inherit method command on the context menu, or the Modify menu.
If all selected methods override built-in methods, they can be deleted and set back to built-in using a single built-in method command on the context menu, or the Modify menu.
In addition, the options Inherit variables... and Override variables... have been added to the Variable panel context menu to allow multiple variables to be inherited or overridden in a single operation. These commands are only present for subclasses, for task, instance and class variables.
Find Possible Calls
The Find Possible Calls... option in the Context menu on the Method list attempts to locate all possible calls to the method, from methods in the current library, or a selected set of open libraries. If there is only one open library, it performs the search immediately, displaying a progress bar. If there is more than one open library, the option opens a popup dialog that allows you to select the libraries to be searched, and then performs the search, displaying a progress bar.
The option writes results to the Find and Replace log, and then opens the Find and Replace window when it has completed the search. Note that the option does not search calculations stored with objects, it only searches method lines.
Calls located may not be actual calls to the method, since for example calls like item.$method cannot be resolved, so if the call occurs in the correct class (or in the inheritance hierarchy), the call will be treated as found.
Method Search
There is a Search or filter option above the method name list that allows you to find specific named methods, or methods that start with or contain specific characters. As you type in the search box, the method list updates automatically to highlight the method names that match or contain the search (in currently expanded nodes only). These lines draw in the color treelinesmatchingsearchcolor in the IDEMethodEditor section of appearance.json. The first matching method for the search is selected and its contents is shown in the Code Editor. The "Show Method Tree Search Box" option on the View menu allows you to toggle the method search box (the default is enabled). The state is saved with the window setup.
The search also includes Object names (as well as method names) to allow you to locate controls and other objects in the method tree list, such as containers or text labels, in order to display and edit their methods. The setting for this search behavior is stored in a new item ‘includeObjectNodesInTreeSearch’ in the ‘methodEditorAndRemoteDebugger’ group in the config.json file (true by default).
While the search box has the focus, you can use the find and replace menu of the method editor (or its find next and find previous shortcuts) to select the next or previous matching method. There is also a context menu item for the method list called "Select Found Methods", which selects all matching methods. There is a menu option ‘Search Method Tree’ on the Find and Replace menu that puts the cursor in the method search box, which also has a keyboard shortcut named "searchMethodTree" that appears in keys.json - note that the default disable all breakpoints shortcut has changed as a result of this change.
The saveSearchDelay item (previously savePropertySearchDelay) in the ide section of the config.json file allows you to set the delay between typing and the search being executed.
Adding Blank Method Lines
When the focus is on a method line, the Append blank lines menu option adds blank lines to the end of the current method and sets the current line to the first added blank line: you can also use the shortcut Ctrl/Cmnd-B when the focus is on the code editing area in the current method. This option behaves in the same way as clicking on the dead space at the end of a method in the method editor (shown in gray), but gives you the option to do this from the Modify menu, or from the keyboard using the shortcut key. Note that when you click away from the method, any blank lines at the end of the method are omitted automatically.
Configuring Blank Method Lines
Omnis adds space for 64 method lines, but you can change this to any value from 1 to 128 inclusive by editing the “methodEditor” section in the Omnis configuration file (config.json): the following entry is at the same level as the “server” entry.
"methodEditor": {

  "stripTrailingEmptyCommands": true,

  "blankLinesToAdd": 64

}
When the method editor saves a method back to the class, that is, as it is being navigated away from, Omnis strips empty method commands from the end of the method. You can disable this behavior by editing config.json using the stripTrailingEmptyCommands option.
Adding Method Lines
You can use the $addbefore() and $addafter() methods with the $methodlines property of a method to add lines to an existing method.
$addbefore(rItem,cText)
adds a new line with content cText before the line specified by rItem (rItem can be either a 1-based integer line number, or an item reference to a line in the method)
$addafter(rItem,cText)
adds a new line with content cText after the line specified by rItem (rItem can be either a 1-based integer line number, or an item reference to a line in the method)
For example:
Do $cclass.$methods.$remove($cclass.$methods.Test)
Do $cclass.$methods.$add("Test")
Do $cclass.$methods.Test.$methodlines.$add("# aaa")
Do $cclass.$methods.Test.$methodlines.$add("# ccc")
Do $cclass.$methods.Test.$methodlines.$add("# eee")
Do $cclass.$methods.Test.$methodlines.$addbefore(2,"# bbb")
Do $cclass.$methods.Test.$methodlines.$addafter(3,"# ddd")
Do $cclass.$methods.Test.$methodlines.$addbefore($cclass.$methods.Test.$methodlines.1,"# New line 1")
Do $cclass.$methods.Test.$methodlines.$addafter($cclass.$methods.Test.$methodlines.2,"# New line 3")
Method Notes
You can add notes to a method to allow you to document each method in a class. The notes are stored in the $notes property for the method. The notes can be edited on the Documentation tab, the last tab in the Variable definition pane. (Existing users should note that the $notes property is the $httpnotes property renamed to $notes, which is available for all methods in a class.)
You can change the width of the fields on the documentation tab in Code Editor by dragging their borders. The positions are not saved, and will revert to equal distribution when resizing the Code Editor or changing method.
Method Notes for Subclasses
The Method Editor shows the inherited or built-in method notes for a method that is either inherited, built-in, or overridden, when the description/notes in the current class is empty. To indicate that these are inherited, they are drawn in the inherited color or built-in color, as appropriate. If you want to change the value for an overridden method, you can right-click on description/notes, and select "Make Editable", and edit the value. You can revert to the inherited value by editing and deleting the description/notes; when the focus leaves the edit field, it shows the inherited value.
Method Bookmarks
You can add Bookmarks to methods or to individual method lines which allows you to mark significant places in your code and easily locate them. You can show Bookmarks in the Method Editor by checking the Show Bookmarks option in the View menu (enabled by default). Bookmarks are stored in a system table called #BOOKMARKS which is in the System Classes folder and can be edited in the Bookmarks editor.
To add a bookmark, Right-click on the method name or in the margin of a method line (where breakpoints are normally shown). When creating a bookmark, you can give the bookmark a name, description and choose a color. Bookmarks added to a method line can be moved up or down using drag and drop.
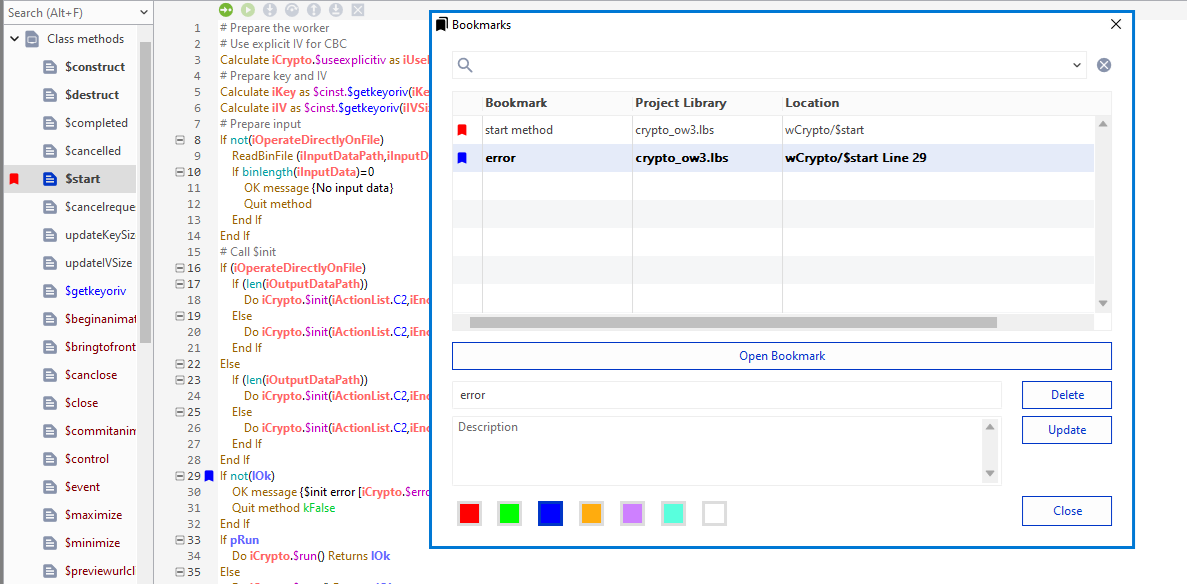
All Bookmarks for the current library are listed in the Bookmark editor which you can open by double-clicking on a bookmark in the Method Editor, by selecting the ‘Open Bookmarks’ option in the View menu, or by double-clicking on the #BOOKMARKS system table in the Studio Browser. You can update, delete, or jump to a bookmark from the Bookmarks list. When jumping to a bookmark, the bookmark is highlighted briefly.
Indenting Methods
Selected methods in the Method Editor can be visually indented, for example, to highlight methods (sub-routines) that are called from a main (public) method. To indent a method, you can right-click on the method or group of selected methods in the method list (left of the Method Editor) and select the Indent Method Left or Indent Method Right option from the context menu. Alternatively, you can select the method or methods and press the Ctrl or Cmnd key plus the [ or ] key to indent the method to the left or right.
Indentations are maintained in the class and are exported to JSON.
Code Editor
The Code Editor allows you to enter Omnis code directly into each command line in a method, and when combined with the Code Assistant, and the keyboard shortcuts, allow you to write Omnis code quicker and more easily. (The “free-type Code” Editor replaces the “point-and-click” code entry panel, available in versions prior to Studio 10, which has been removed from this version, that is, you cannot revert back to the old code entry panel.)
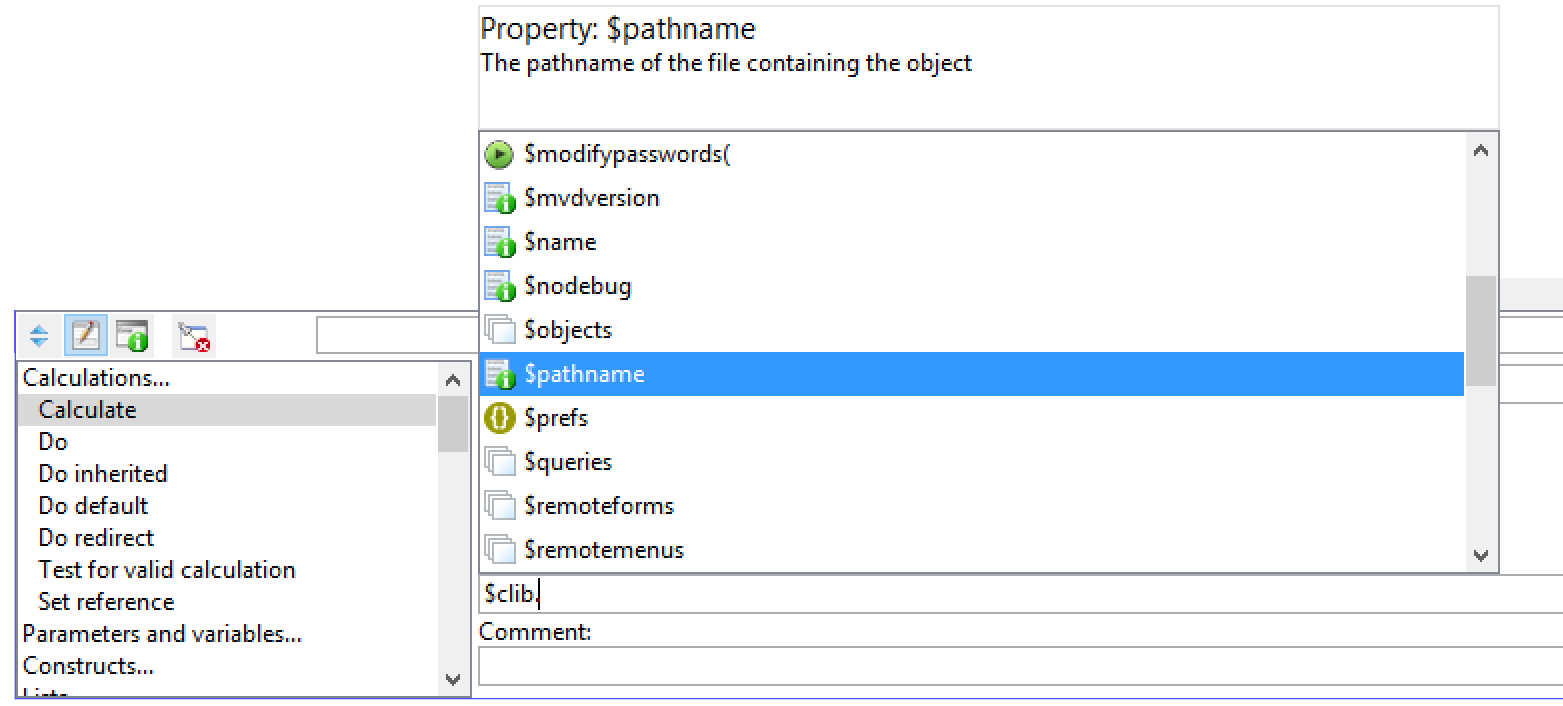
To enter a command, you click into or tab to an empty command line and type the first letter or the first few letters of a command name and select it from the Code Assistant that pops up: in some cases, you will only need to type the first letter of a command to select it, such as “d” to find the Do command.
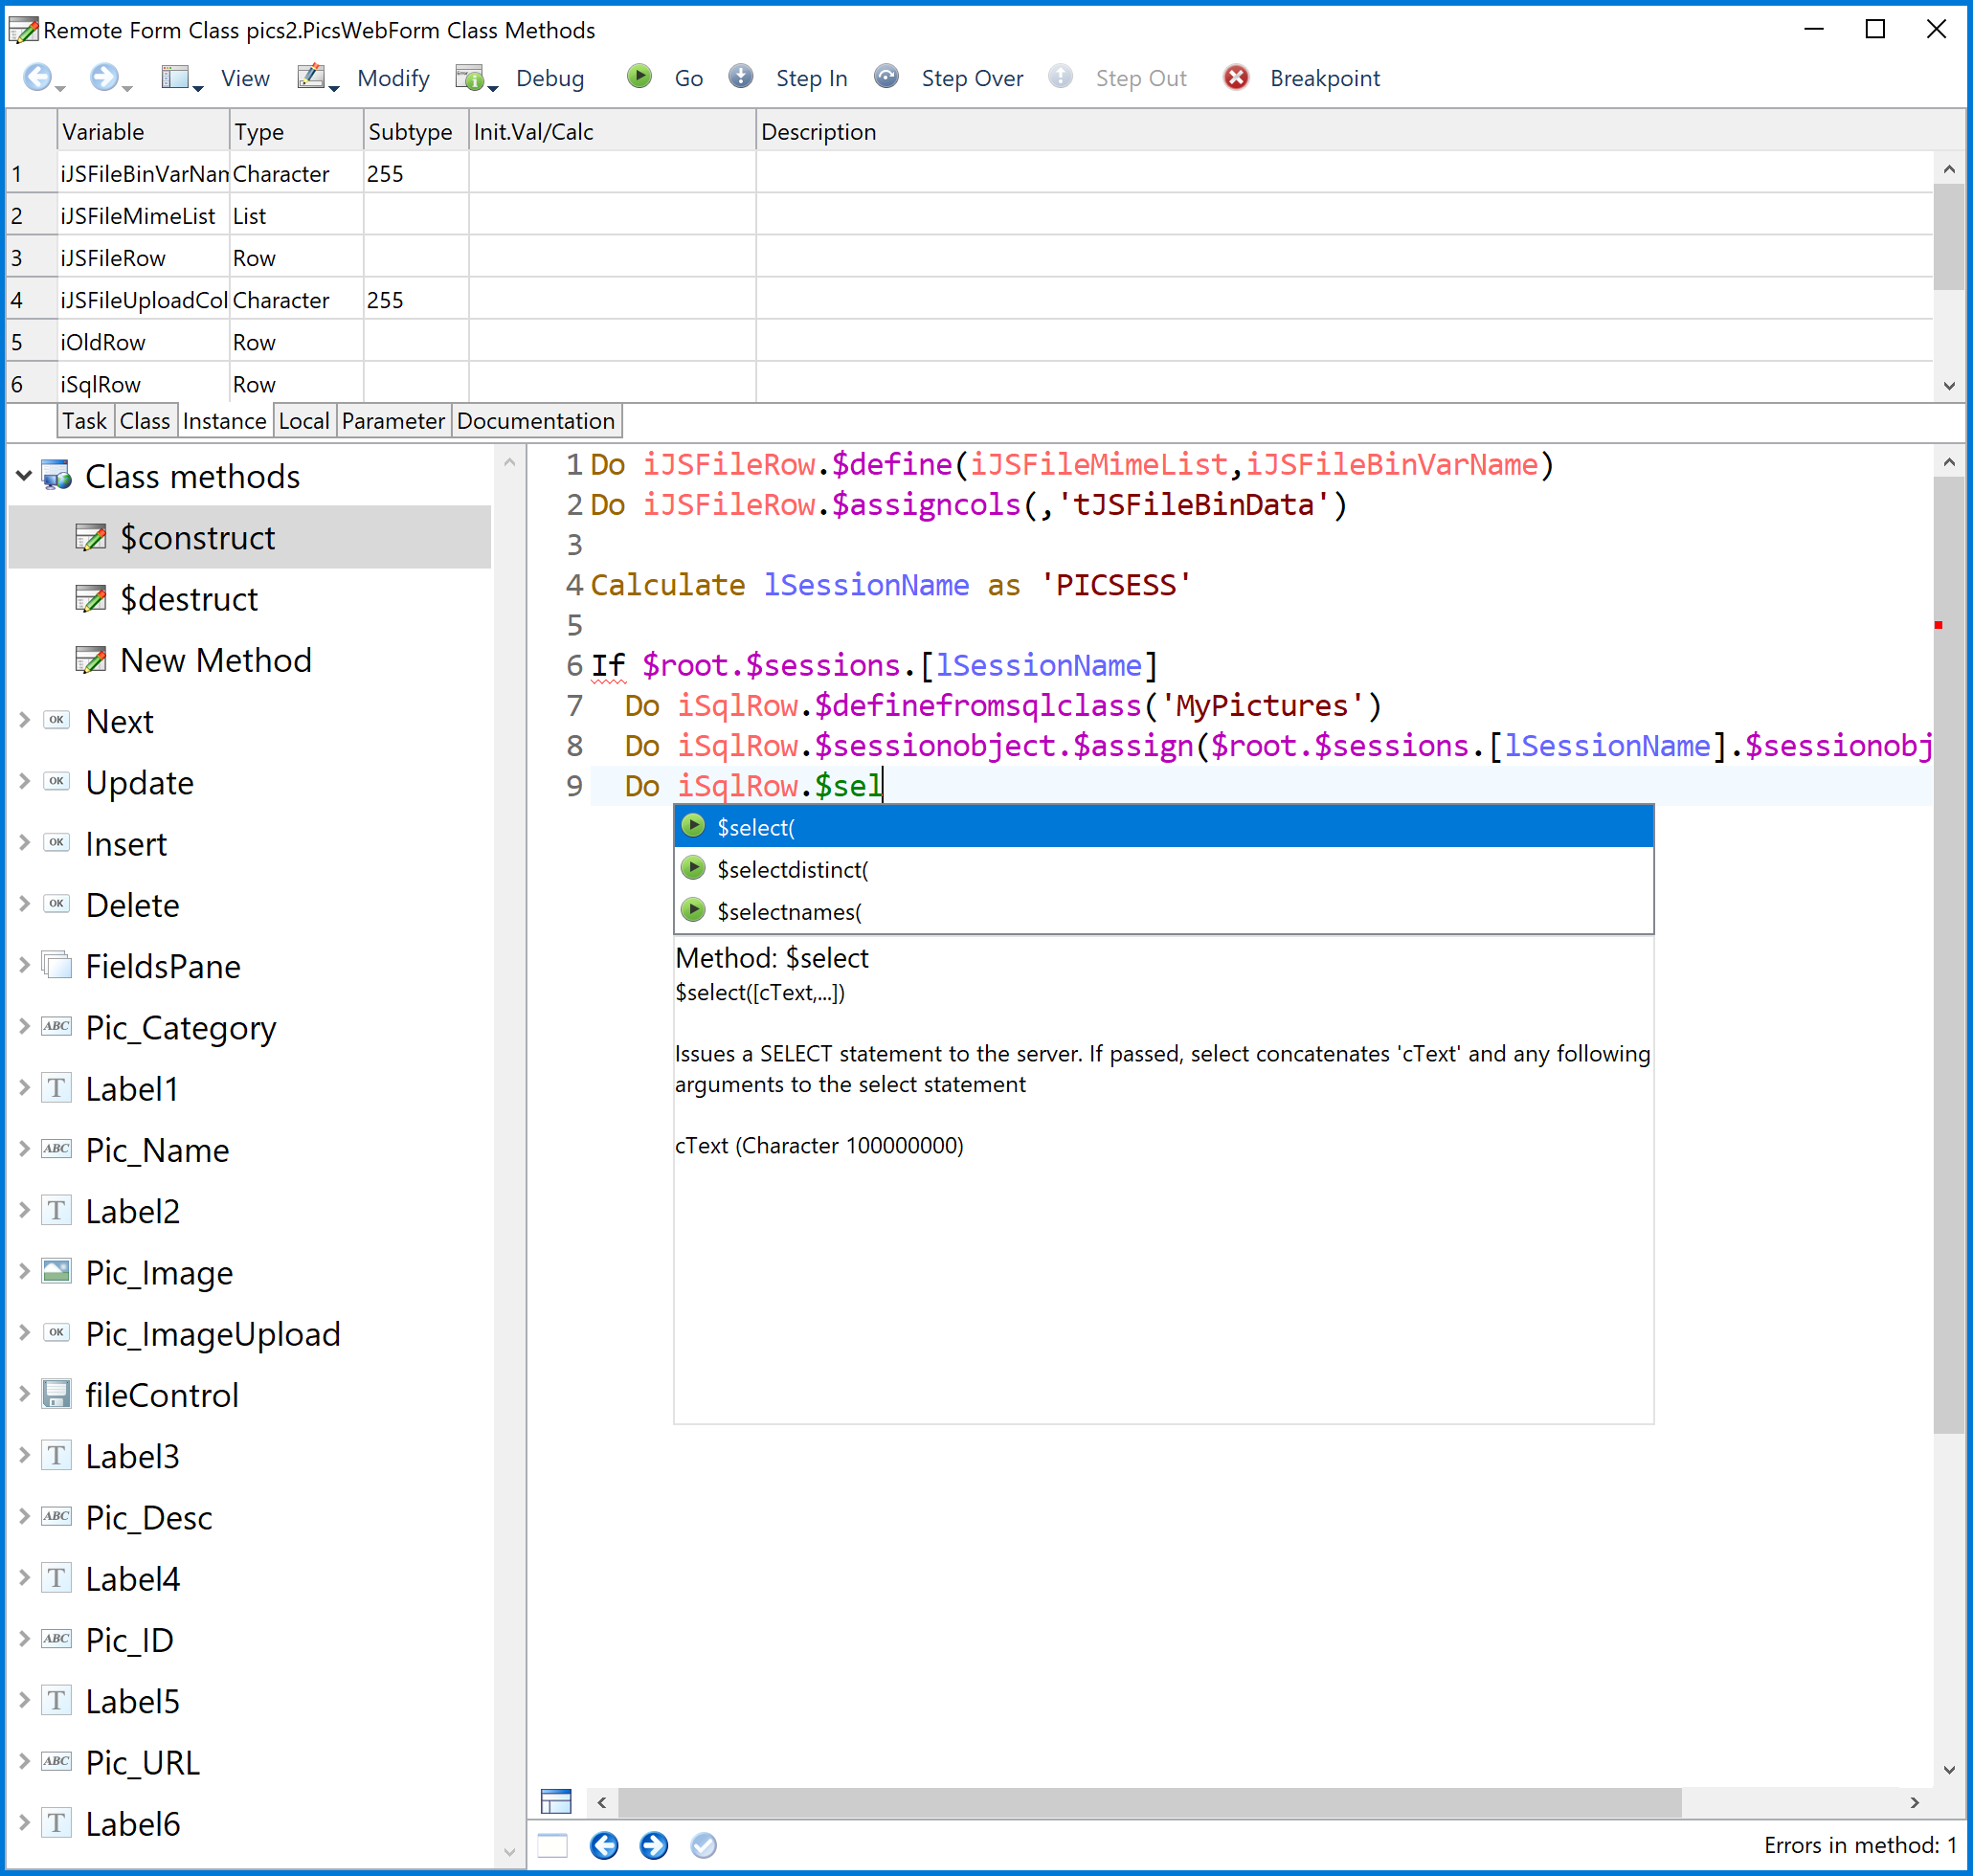
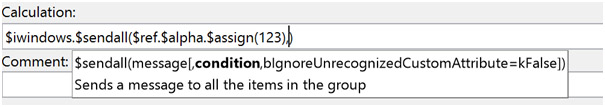
As you complete or select a command name or a parameter, the insertion point will move to the appropriate point in the command line, and the Code Assistant will provide more help as you type, including help with command syntax, variable names, parameters, command options, as well as property and method names. For example, in the following screen, after typing “$sel” all possible methods are shown in the Code Assistant popup list, in this case $select() and so on (see Code Assistant for specific information about the Code Assistant).
To enter a line of code in the Method Editor:
Click or tab into an empty method line: the insertion point should be at the start of the empty method line. You can press Ctrl-N to create a new line under the current line
Type the first few letters of the command you want to enter: for most commands you will only need to type 2 or 3 characters (you can ignore case and leave out any spaces in the command name)
As soon as you start to type, the Code Assistant will drop down automatically showing a list of commands that match the characters you have typed: you can press Tab to select the first/selected command in the list, or use the Arrow keys to navigate up or down the list, and press Return/Enter to select a command
Having selected the command, you can start to fill out its parameters: again, you can type the first few characters of a variable name or parameter and select it from the Code Assistant help list
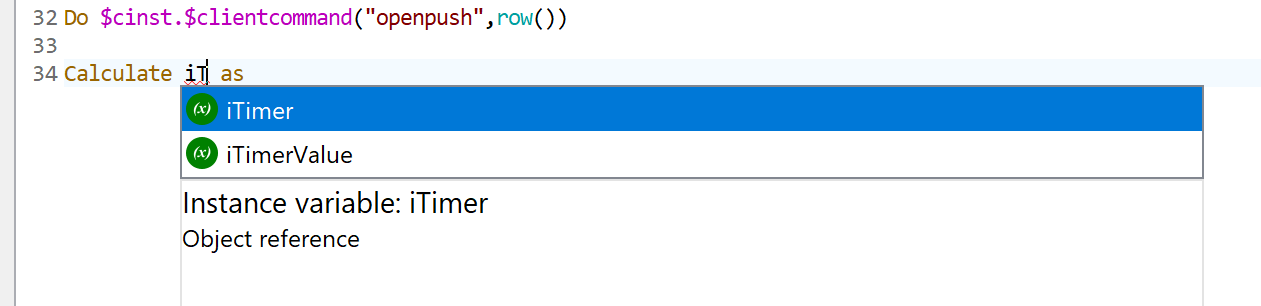
For example, to enter a calculation using the Calculate command, you can type “ca” (note lower case) and press the Tab key to select the Calculate command from the help list, which should be the first command in the list. The insertion point should now be between ‘Calculate’ and ‘as’. Type the first few characters of the variable name or notation you want to enter, select the variable or notation from the help list (you can press Tab to select the first item in the list):
Once you have selected the variable name for your calculation, you can press Tab to go to the end of the command line, in this case, after the ‘as’, and then enter the calculation, including any functions or notation.
In all other respects the Method Editor behaves the same as in previous versions, including the Chroma coding which has been greatly enhanced with an updated theme. The following sections provide more detail about entering commands in the enhanced Method Editor.
Tokenization
Omnis is a tokenized language, which means that all method text has a single canonical representation generated from the tokenized representation of the code. As you enter text into the Code Editor, Omnis tokenizes the code and then updates the editor with the canonical representation. For example, this means that extra whitespace will be deleted, and attempts to indent the code using a non-default indent will have no effect. Each level of indent corresponds to two spaces.
Bad name detection
Bad notation names are detected while entering code rather than handling this through automatic retokenization using double slashes. The ‘badNotationNameIsSyntaxError’ item in the ‘ide’ section of config.json controls this behavior; the default is True. Set this to false to restore the previous behavior.
Fonts
The Code Editor supports variable-width fonts. The various elements of the Code Editor, including the code area and method list, use the default fonts provided by your current operating system: e.g. on Windows Segoe UI and Consolas are used as the default fonts. You can change the fonts used under the View>>Fonts option, while the Reset option lets you return to the default fonts for your OS.
Ctrl-space
The Code Assistant drops down automatically when you type a command name, function or some notation, but you can force the Code Assistant to open at other times. To open the Code Assistant manually, position the caret in the code text, press Ctrl-Space, and the text immediately before the caret is used to determine the contents of the Code Assistant help list.
One situation in which this is useful is if you cannot remember the syntax of a command or function: position the caret immediately after the command or function name, press Ctrl-Space and then down arrow, and you will see the syntax for the command or function in the Code Assistant help list. See Code Assistant.
Multi Undo and Redo
The Method Editor supports multiple levels of Undo, and Redo. (The multi-level Undo/Redo also applies to all Edit fields in the fat client and IDE.)
Read-only Mode
When the Modify menu is enabled in the Code Editor, you can toggle the editor between read-only and write mode using the keyboard shortcut Alt+M / Cmnd+Opt+M (stored in $keys). The method editor stores the state of "Read-only mode" with the Window Setup.
Copying Methods or Code Lines
You can copy a selected method in the Method name list (on the left) using the standard Edit menu Copy option (or Ctrl/Cmnd-C), or the Method Editor context menu Copy option.
While working in the Code Editor (on the right), you can copy a line or selected lines of code (text) using the standard Edit menu Copy option, but only the selected characters will be copied. Alternatively, you can use the Copy Lines option in the Code Editor context menu to copy the complete code in the current line (the line containing the caret), or all complete lines in the current selection.
You can select all the lines in a method using the Select All option in the Edit menu or the Ctrl/Cmnd-A keyboard shortcut. For long methods that extend down beyond the visible area in the Code Editor, all lines are selected but the editor window does not scroll. However, in this case, if you want the editor window to scroll, you can set the "selectAllCanScrollCodeEntryField" setting in the "methodEditor" section of the config.json file to true (false by default); this allows you to select the whole method and see the end of the method.
When you copy a method or lines of code, Omnis copies the syntax coloring and other formatting, therefore, this would allow you to paste the code into a word processor or an email and retain the colors and formatting (the code is copied in HTML format on macOS and Windows).
Printing Methods
You can print a method using the Print option in the File menu; the print output will be sent to the current destination. Omnis uses the syntax colors from the default design theme (which is designed for a white background), i.e. if you are using a dark theme in the Code Editor, this will be ignored. You can turn off this behavior (and print everything using black text) by setting the entry “printMethodsWithSyntaxColors" in the “methodEditor" section of config.json to false.
Entering Commands
To enter an Omnis command the cursor must be on an empty line, and you can start to type the name of the command you need. As soon as you type the first letter, the Code Assistant will open automatically, displaying a list of commands starting with that letter: note that the command filters may limit which commands are shown, see below about the filters. As you type further letters of the command name, the Code Assistant refines the list of available commands. In most cases you will only need to type the first 2 or 3 letters to locate a command. The text immediately before (to the left of) the caret is used to determine the content of the Code Assistant help list.
To select a command from the Code Assistant help list, you can press the Tab key to select the first command displayed in the list, or you can use the arrow keys to navigate up and down the help list and use Return to choose the selected command.
Assuming the cursor is at the end of the selected command name, you can start to enter its parameters, and the Code Assistant should pop up automatically at the insertion point whenever a variable name or parameter is needed.
Command Filters
The commands in Omnis perform many different functions, including many legacy features that are no longer required for creating web and mobile apps using the JavaScript Client. There is a filter mechanism in the Code Editor to filter the list of commands that are displayed in the Code Assistant help list, primarily to remove any old commands, including those that allow you to manage Omnis datafiles.
Note you can still use the excluded commands in your code, and methods in converted libraries using these commands will continue to work – the filters just hide the commands from the Code Assistant help list.
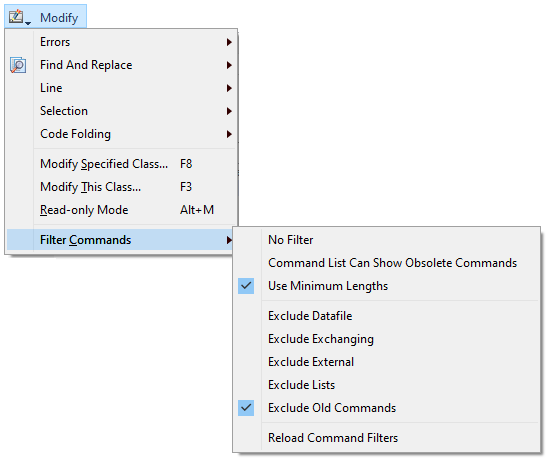
The command filter is set under the Filter Commands submenu in the Modify menu: note this is only visible when the cursor is in the code entry area in the Code Editor. The Exclude Old Commands filter is enabled by default, which excludes over 100 old commands, plus there are other filters available that exclude smaller subsets of commands. You can disable the current filter using the No Filter option, in which case all the commands available in Omnis will be shown in the Code Assistant help list.
The current filter option is saved with the Window Setup for the Method Editor: if the saved value is no longer present, the editor reverts to no filter and all commands will be shown in the Code Assistant.
The Reload Command Filters option reloads the filters from the commandfilters folder, without having to quit Omnis, which is useful if you have changed or added any filters.
Further Command Filtering
Normally, all commands matching the first typed character appear in the Code Assistant list, but you can limit or change which commands are shown depending on the number of characters typed – this may be useful if you want specific commands to always appear, instead of the default ones that appear first in the alphabetical list of commands.
You can control this type of filtering using the Use Minimum Lengths option on the Modify>>Filter Commands submenu, and this option is enabled by default. For example, with this enabled, the Do command will be selected by default when you type 'd' (rather than the Default command), and Quit method will be selected by default when you type 'q' (rather than the Queue commands); in the latter case, you can type ‘qu’ to show all the Quit commands in the Code Assistant list (note the Queue commands only apply to wndow classes in desktop apps).
The filtering enabled by the Use Minimum Lengths option is controlled in the file min_command_characters.json (located in the ‘studio’ folder) which specifies the minimum number of characters to be typed for a specified command.
The JSON file contains an object, where each member name is either a command name, or a regular expression matching a set of command names. The value of each member is the minimum number of characters to type (default 1 if there is no match for a command). In the following example, Quit method appears as soon as you type ‘q’, whereas the other Quit commands require you to type ‘qu’, and the Queue commands require you to type ‘que’:
"^Queue.*": 3,

"Quick check": 4,

"Quit method": 1,

"^Quit.*": 2
Regular expressions must start with ^, otherwise the entry is treated as a full command name.
If the file is not present in the studio folder, or if it cannot be loaded for some reason (e.g. invalid JSON syntax), the Use Minimum Lengths menu item is hidden.
Omnis loads the file min_command_characters.json at startup, and when you execute the Reload Command Filters command on the Filter Commands menu.
Editing the Command Filters
You can create your own filters, or change the ones provided, to change the commands that are shown in the Code Assistant help list. If you wish to adapt the default filter, you are advised to make a copy of it, rename the copy, then edit and save the new file.
The command filters are located in a folder called ‘commandfilters’ in the Studio folder: the default filter is called ‘Exclude_Old_Commands.json’. Each file in this folder is loaded in the Filter Commands submenu, and the name of the JSON file is used as the menu option name. (You can examine the contents of each filter file to see which commands they exclude from the Code Assistant help list.)
The content of each JSON file is an object with a single member named “exclude”, listing any commands that are to be excluded from the Code Assistant help list. The exclude member is an array, and each array entry is the exact command name (case insensitive).
You can exclude groups of commands using a regular expression to match command names: in this case, you need to anchor the regular expression to the start, using ^. For example, to exclude all old MSM… commands, you can create a filter file with the following contents (name the file ‘Exclude_MSM_Commands.json’):
{

  "exclude": [

    "^MSM.*"

  ]

}
As well as creating an exclude filter, you can create a filter to only include certain commands, although in practice this might only be useful if you want to use a very small subset of commands in the Method Editor (since all commands that are not included are excluded). To create an include file, create a new filter file containing an “include” object, and add any command names to be included, e.g. to only include Do and Calculate (and exclude all other commands!), the filter should contain:
{

  "include": [

    "do",

    "calculate"

  ]

}
The default or initial filter is set in the ‘currentCommandFilter’ option in the ‘codeAssistant’ section of the config.json file: if this is empty, or the command filter files or folder are removed, then "no filter" is selected.
You need to select the Reload Command Filters option in the Modify menu to load any new or edited filters into the Filter Commands submenu.
Case and Omitting Spaces
You can ignore the case of all command names, so you can always start to type a command name in lower case. Furthermore, if the command name includes spaces, you can omit the space(s), which will speed up command selection in the Method Editor.
Whether or not you include the space can, however, determine which command is selected by the Code Assistant: this is important for the Do… commands, for example. Typing do<space> will immediately enter a Do command (and the insertion marker will be ready to accept the calculation) and close the Code Assistant. Whereas, to select the Do method command, you can type dom<tab> (note you can omit the space), or to select the Do async method command, you can type doa<tab>. This is quicker than typing just ‘do’ and then selecting the command you want from the droplist in the Code Assistant.
Another example would be in the case of the If… commands. Typing if<tab> will immediately close the Code Assistant and enter an If calculation command, whereas, to select the If canceled command, you can type ifc<tab> (note no space). Similarly, typing on<space> will select the On event command, while typing ond<tab> will enter the On default command.
Tab key
You can use the Tab key to tab between the parameters of all of the commands in the method. This is an easy way to navigate through the commands, skipping command names and keywords and moving the insertion point to the next available position. You can also use the Tab key to select the first or selected line in the Code Assistant: in this case, if you select a method, such as Do List.$define, the opening and closing parenthesis () will be added automatically and the cursor is placed between the parenthesis.
Construct Commands
If you enter a construct command using the Code Assistant, such as If, it will add the end construct command automatically, in this case, End If. You can use Undo to remove the end construct command added automatically if it is not required.
The Method Editor checks for missing associated commands as you edit, e.g. If with no End If, or For with no End For.
Command Options or Keywords
For commands that have options or keywords, usually enclosed in parenthesis, you can enter the options from the keyboard automatically. To show the options or keywords for a command, press Tab directly after typing the command name. For example, after typing Do, For and Enter data, press Tab and the Code Assistant appends the optional keyword(s) to the command, ready for you to enter its parameter(s). If you do not want the keyword added by tab, the Undo command will remove the option(s).
This occurs when the cursor is somewhere in the command, the command does not have the missing keyword, and no characters are selected. For example, pressing tab after entering Do $cinst.$test() will add the Returns keyword. In the case of the For and For each line in list commands, tab will cause the keywords from, to and step to be added in turn.
There is an option on the Line menu, Tab Adds Missing Optional Keyword, which controls this behaviour (it is enabled by default); the state of this option is saved with the Code Editor window setup.
Construct Parameters
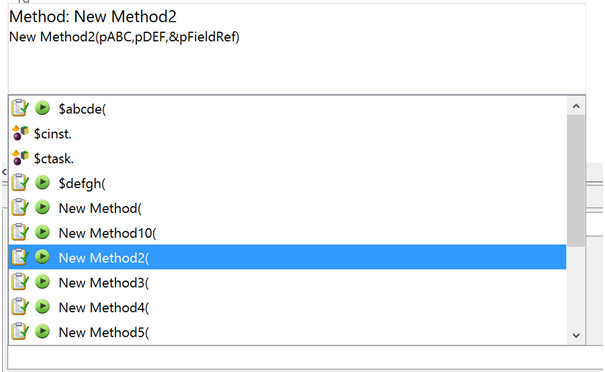
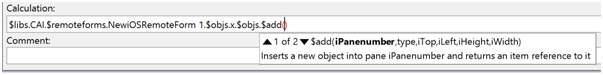
Where possible, the Code Assistant help window expands “params...” for $add, $open, etc to show the constructor parameters of the class referenced. Omnis identifies the class name that precedes the method name in your code (e.g. classname.$open), and will show the construct parameters for the class.
Class Names
To enter a quoted class name, you can press Ctrl-Space when the caret is positioned after a double quote (or some text following a double quote) and select the name from a quoted list of non-system class names in the current library.
File Class Field & Library Names
When unique field names is true, the Code Editor does not enter a file class name prefix when you enter a file class field/variable name into the Calculate command, for example, for file classes in the same library as the class being edited. There is a configuration item called ‘checkFileClassPrefixBasedOnUniqueFieldNames’ to control this behaviour (true by default).
When unique field names is false, checkFileClassPrefixBasedOnUniqueFieldNames requires that you enter a file class name prefix, for file classes in the same library as the class being edited.
In addition, the Code Assistant only shows file class field names at the top level when unique field names is on; so if unique field names is off, the list just includes the file class names.
The Code Assistant includes library names at the top level, to allow references like lib.file.field to be entered, or lib.<library notation> to be entered.
Method Name Matching
You can search for a method name where the name of a method is required in a line of code. To do this press Shift-space after entering a string in the Code Assistant and any possible matching method names are added to the help list. For example, you could enter: Do code method test and then press Shift-space, and the Code Assistant displays all strings containing “test” that can be used as a method name parameter of Do code method.
For notation, if you enter $test and then Shift-space, the Code Assistant only shows matching strings that are notation (start with $) and contain “test”.
Side by Side Editors
You can open two instances of the method editor to show two methods from the same class, for example. You can open a second copy of the method editor as follows:
Press the Shift key while performing an action that opens the method editor, such as double-clicking on a remote task.
Use the Two Editors Side By Side option on the method editor View menu.
Omnis opens a second editor, next to the current editor window, so that each editor uses half of the available screen space. On Windows, this means the available space in the main Omnis application window, and on macOS, it means the available space on the current monitor less the menu bar or toolbars.
When two editors are open, the same method in each class can be selected in both editors, but the editor in the background does not display the method: it displays the text "This method is being edited in another method editor”.
The editor in the background keeps up to date with changes in the foreground editor, e.g. when you add or delete a method, the method list in the other editor updates.
There is a keyboard shortcut for the Two Editors Side By Side command, which defaults to Alt+S on Windows and Cmd+Opt+S on macOS.
Debug Panel
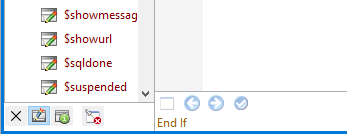
The Method Editor has two panels below the code entry window: the Debug panel and the Editor panel. You can show the Debug panel (or hide it) using the buttons under the method name list in the lower left corner of the Method Editor window (the X option will hide both panels).
The equivalent options are on the Bottom Panel hierarchical menu on the View menu in the Code Editor.
Editor Panel and Errors
As you enter code, Omnis tokenizes the entered code and provides real-time feedback that indicates if the method code is valid. Valid method code is syntax-colored, whereas invalid method code is partially syntax-colored, and the invalid component(s) in the method line underlined using a colored wavy line (the color is taken from the current theme or set in the “badsyntaxcolor” $appearance preference).
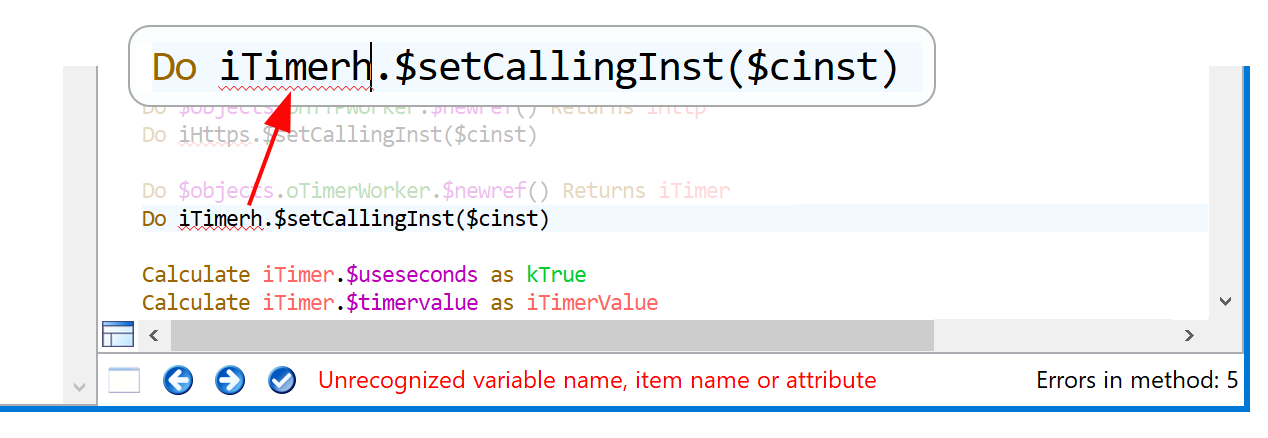
The editor panel at the foot of the Method Editor window displays the number of method errors, and when the caret is positioned within text causing an error, it displays the error text.
The editor panel has three buttons that allow you to handle errors. The Next and Previous error buttons (forward and back arrows) navigate through the errors in the method. The Fix error button (check mark) allows you to fix certain errors and will only be enabled when the caret is positioned in some text for an error. The Fix button is enabled to allow the following errors to be fixed:
“Unrecognized variable name, item name or attribute” and "Unrecognized variable name”: Pressing the Fix button opens the Create Variable dialog.
“) missing”: Pressing the button adds the )
“Partly entered keyword”: Pressing the button completes the keyword
In addition, the editor draws a red marker in the vertical scrollbar for each method line containing an error. The marker in the scrollbar is positioned so that when the method line containing the error is scrolled to be the first displayed line, the top of the scrollbar thumb lines up with the top of the marker. (Note that this is why the vertical scrollbar always allows scrolling even if all method lines fit within the editor window.)
Editor Helper dialog
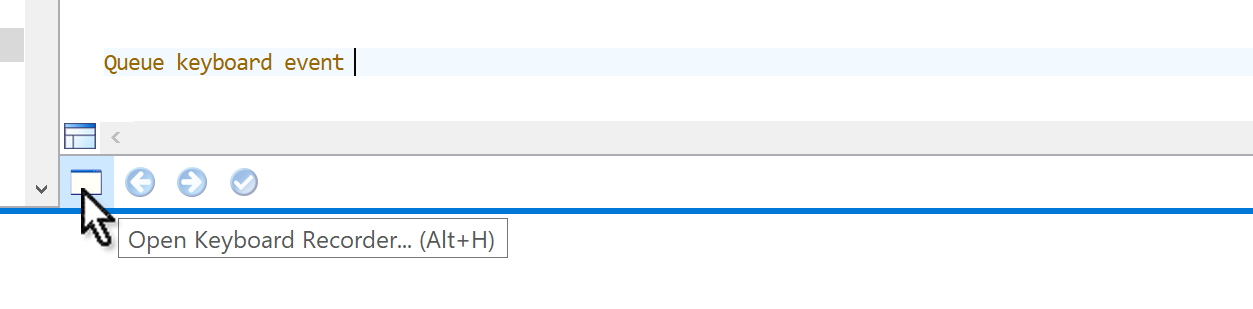
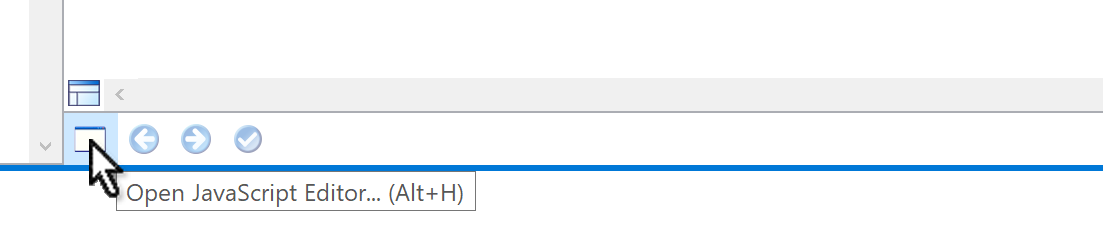
In addition to the error reporting, there is a button to open the Helper Dialog, which is context specific. This button is disabled when the context means there is no helper dialog. If a helper dialog is available, the button is enabled, and its tooltip changes appropriately: pressing Alt+H will open the Helper Dialog.
The editor Helper Dialog is enabled in the following cases:
When the caret is positioned in the parameter field of the Queue keyboard event command. In this case, the helper dialog allows you to record keys.
When the caret is positioned in the title parameter of the Working message command. The helper dialog is the working message configuration dialog.
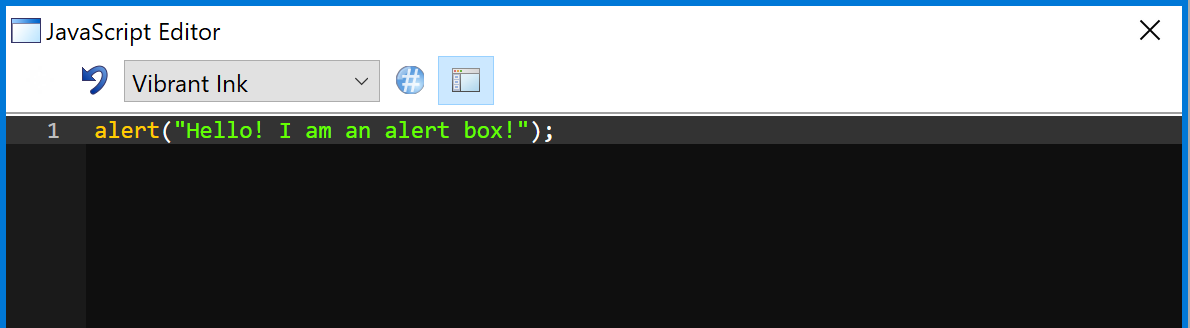
When the selection includes only JavaScript: commands (in a client executed method). The helper dialog button will open the JavaScript editor. All JavaScript: command lines in the same contiguous block are selected, and their JavaScript is then editable using the popup editor. When the popup editor closes, Omnis replaces the selected JavaScript: commands with JavaScript: commands containing the contents of the popup JavaScript editor.
When the selection includes only Sta: commands (for entering a SQL statement on multiple lines). The helper dialog opens the same external editor for JavaScript but in SQL mode allowing you to enter a SQL statement over multiple lines.
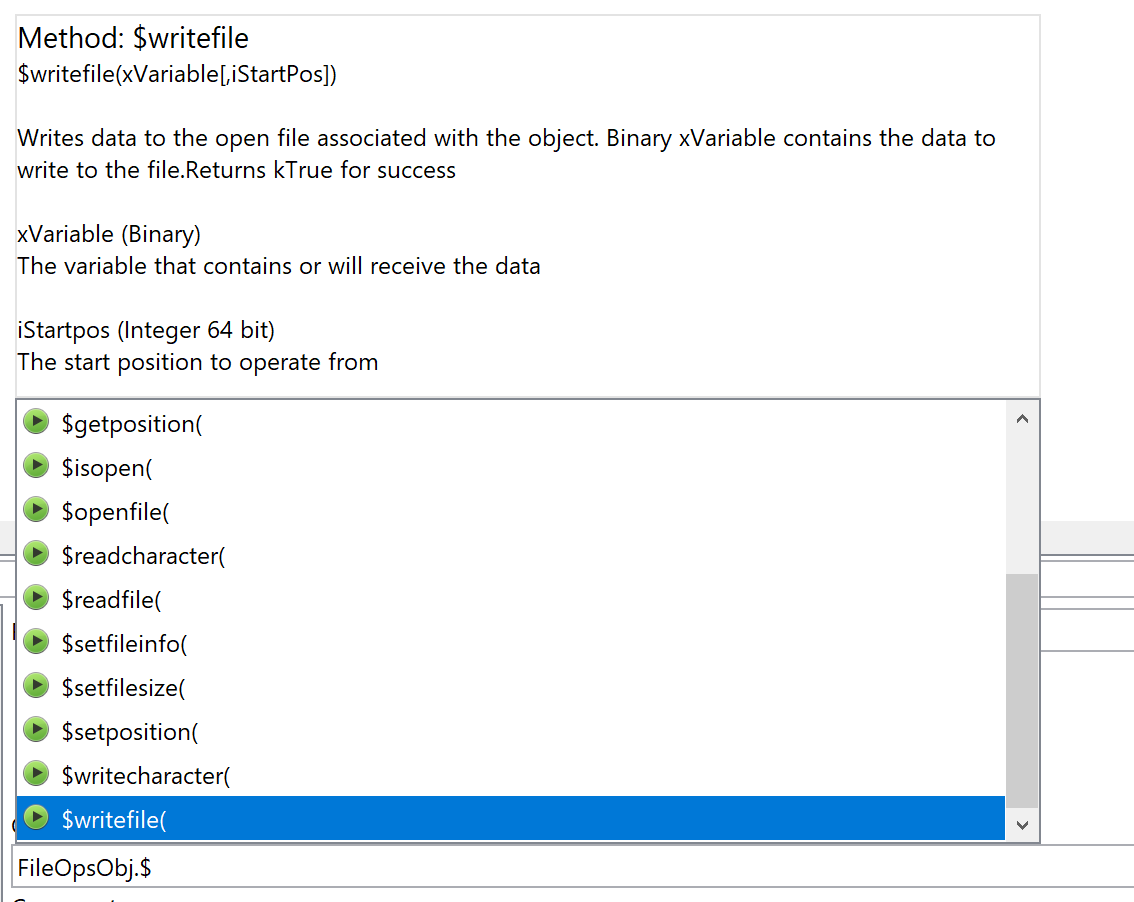
Command Syntax Help
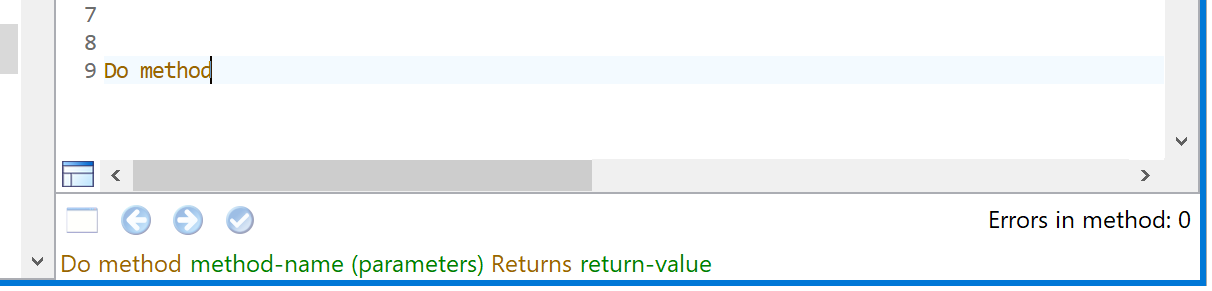
You can view the full syntax for a command, including all its parameters and options, in the Help panel at the bottom of the editor window. This type of help is displayed once you have selected a command from the Code Assistant list, or you have typed the command name in full – as you reach the last character of the command the syntax help is shown. For example, if you type the Do method command, its syntax is show in the Help panel at the bottom of the editor window.
You can hide the command syntax by unchecking the "Show Syntax Strings" option on the View menu.
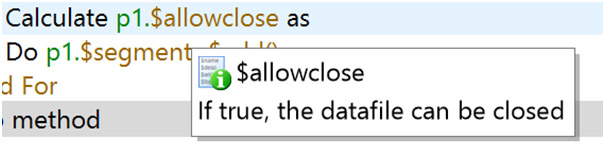
Method Tips
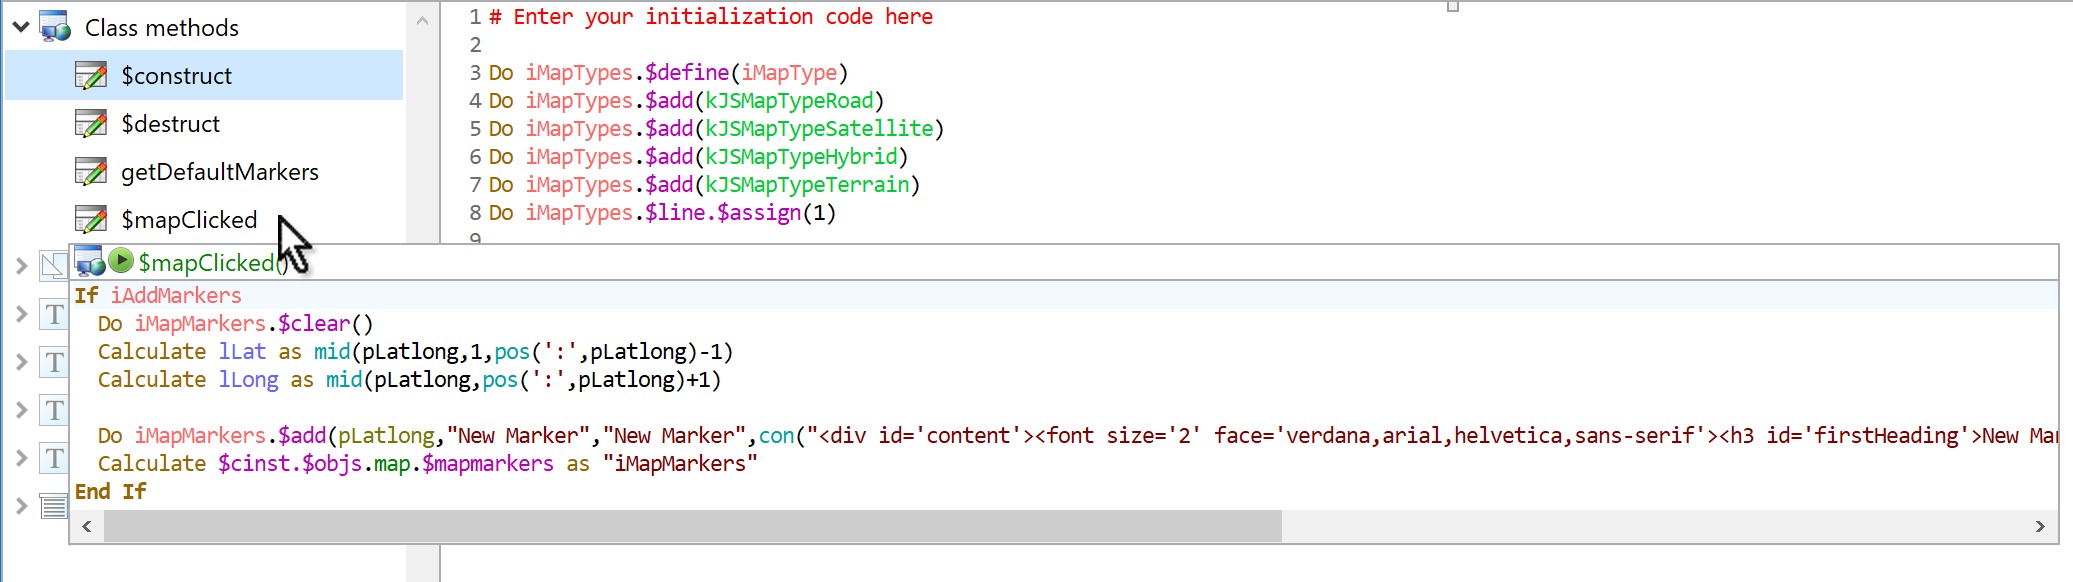
Method Tips or tooltips are displayed when you hover the pointer or I-beam over a method name in the Method Editor, including methods listed in the Method tree list on the left of the editor window:
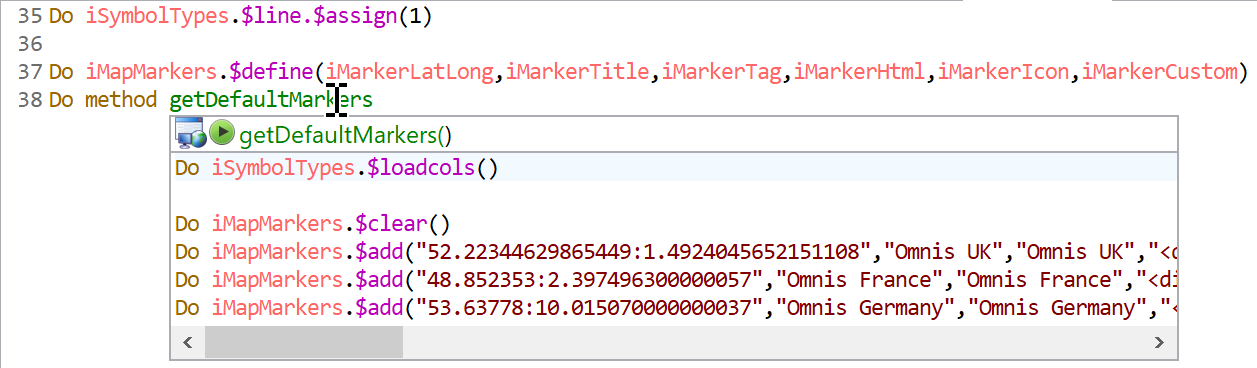
or method names that are being called in your code (assuming Omnis can identify the method being called).
The method name and its code are displayed in the popup tip window and you can scroll longer methods using the mouse or trackpad. You can hold down the Shift key to keep the tooltip window open when you move the pointer, which allows you to scroll the window more easily.
The Method tips provide a useful preview of a method, without having to switch away from the current/selected method you’re working on. You can dismiss the method tip by moving the mouse away from the method name and tooltip, or by pressing Escape.
There are three entries in config.json that control the size of the Method tips:
"maxWidthOfMethodTooltip": 500 (value in pixels)
"maxHeightOfMethodTooltipGeneralInformation": 100 (value in pixels)
"maxVisibleMethodLinesInMethodTooltip": 20 (number of lines)
When used with the method tree list, the maximum width used is the width of the code edit text field if it is wider than the maxWidthOfMethodTooltip config item.
Code Folding
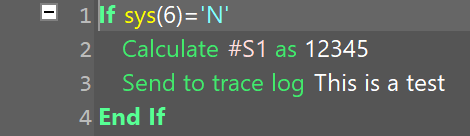
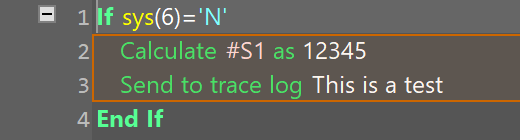
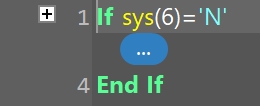
The Code Editor allows you to fold and unfold (collapse and expand) blocks of code in order to assist with readability and code manipulation in general. If a code block can be folded, a ‘-‘ icon appears in the margin at the start of the block: when a block has been folded a ‘+’ icon is shown next to the first line of the block, and directly under this is shown a “badge” (an ellipsis icon) representing the hidden code content.
The Code Editor shows a fold icon ( ) in the left margin which shows that a code block can be folded: you can click on the icon to fold the block, and the icon will toggle to show an unfold icon (
 ) to show that the block can be unfolded. For example, this is a code line before code folding:
When the mouse is over the fold icon, Omnis highlights the block that will be folded, for example:
After you have clicked the fold icon, and the code has been folded, the content is shown as a badge (ellipsis) representing the content of the folded block:
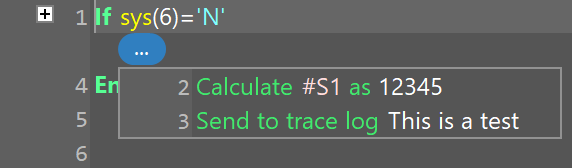
When the mouse is over the badge icon, Omnis displays a tooltip to show its content (this is like the method content tooltips already in Studio 10.1), but note that this tooltip is always displayed, irrespective of the Show Method Content Tips option. For example:
Just like method content tips, pressing the Shift key while the tooltip is displayed locks it in place until you remove the Shift key and move the mouse away. You can select the text in the tooltip and copy it to the clipboard.
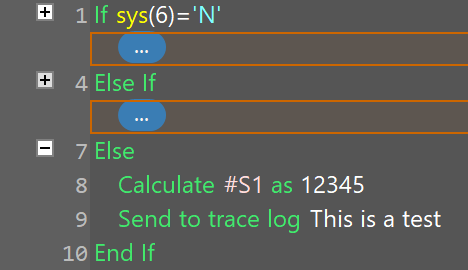
You can also press the Control (Windows) or Command (macOS) key while the mouse is over a fold or unfold icon. In this case, if the command has multiple blocks that can be folded or unfolded, Omnis highlights all the affected blocks, and pressing the fold or unfold icon while all blocks are highlighted opens or closes all the highlighted blocks. For example:
Code folding is only available in a block when there are at least two method lines: for a block that has a single line only, folding is not enabled for the block, so the folding icons are not shown, and the options in the folding menu are disabled.
Which Commands can be folded?
The following Omnis commands can be folded:
All If commands, folded until the next Else, Else If or End If command in the same block.
Else, folded until the next End If command in the same block.
All Else If commands, folded until the next Else, Else If or End If command in the same block.
All While commands, folded until the terminating End While command of the block.
Both For commands, folded until the terminating End For command of the block.
Repeat, folded until the terminating Until… command of the block.
Switch, folded until the terminating End Switch command of the block.
Case, folded until the next Case, Default or End Switch command in the same block.
Default, folded until the next Case, Default or End Switch command in the same block.
Begin reversible block, folded until the terminating End reversible block command of the block.
Begin critical block, folded until the terminating End critical block command of the block.
On and On default, folded until the next On or On default command, or the end of the method if there is no such command.
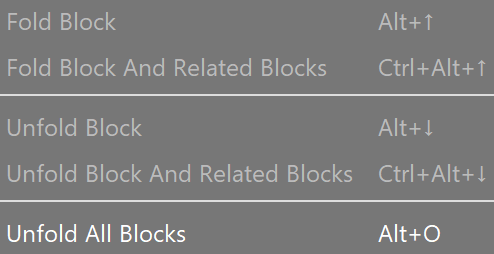
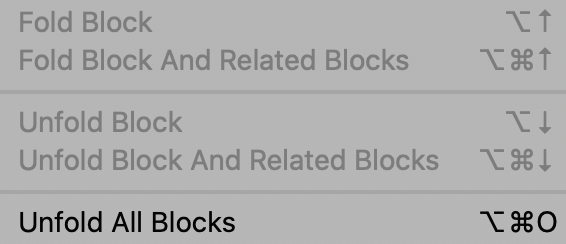
In addition to using the fold or unfold icons in the left margin, you can use the fold/unfold options on a new Code folding menu, that can be used when the code editor has the focus. In this case, most of the menu items apply to the block containing the single line of code that is currently selected.
The Code folding menu is present on the Modify menu of the Method Editor and the Remote Debugger window for a remote debugger edit session. For a remote debugger debug session, there is a new Code menu on the toolbar, containing the Code folding menu commands.
The menu commands are:
| Fold Block |
Equivalent to pressing the Fold icon to fold the block. |
| Fold Block And Related Blocks |
Equivalent to pressing the Fold icon while holding the Control (Windows) or Command (macOS) key to fold the block and other related blocks that can be folded. |
| Unfold Block |
Equivalent to pressing the Unfold icon to unfold the block. |
| Unfold Block And Related Blocks |
Equivalent to pressing the Unfold icon while holding the Control (Windows) or Command (macOS) key to unfold the block and other related blocks that can be unfolded. |
| Unfold All Blocks |
Unfolds all folded blocks in the method. |
The menu items also have shortcuts:
You can configure the keys for these shortcuts using the keys preference item, in the methodEditorAndRemoteDebugger group (in the keys.json file):
| codeFold |
Opt + Up Arrow |
| codeFoldRelated |
Cmnd + Opt + Up Arrow |
| codeUnfold |
Opt + Down Arrow |
| codeUnfoldAll |
Cmnd + Opt + O |
| codeUnfoldRelated |
Cmnd + Opt + Down Arrow |
Selecting Code using the pointer
You can select the badge representing a code folded block, either using the keyboard or using the mouse. When the badge is selected, the content of the block it represents is selected. In addition, double clicking on the badge selects its content.
When Omnis needs to select a line in a folded block, e.g. when hitting a breakpoint, or clicking on a stack list entry, the editor automatically unfolds the block (and any containing blocks) in order to display the line correctly.
Entry Behavior
As soon as an edit would affect a folded block, Omnis automatically unfolds the block (and any containing blocks) before applying the edit.
Saving the Code Folding State
Omnis stores the code folding state with the method.
When using the method editor, the state is saved back to the class with the method, provided that the editor is not operating in read-only mode. In the latter case, you can still fold or unfold methods in a read-only class, but changes to the code folding state are not saved to the class.
When using the remote debugger, changes to the code folding state are saved locally to the cache of methods loaded from the server. However, once you re-open the debug session, these changes are lost; the one exception to this is any code folding that has been applied while editing a method in a remote debug edit session.
Therefore, you should consider code folding a semi-permanent state, since as soon as Omnis needs to display the contents of a folded block for some reason, it will open the block.
Removing Code Folding
You can remove code folding from all the methods in a class or all classes in a library. All classes that can contain methods have the method $removecodefolding which removes code folding from all methods in the class, and returns the number of methods from which code folding was removed. For example, to remove code folding from all methods in all classes in a library, execute: Do $libs.library.$classes.$sendall($ref.$removecodefolding())
JSON Export
The option ‘exportcodefoldingstate’ in the $exportimportjsonoptions Omnis Preference ($root.$prefs) controls whether or not the code-folding state in the methods in your library is exported; the option is set to false by default so the code folding state is not exported.
If the code folding state is exported, Omnis appends the string $… to the inline comment of commands that correspond to a code folded block. This allows Omnis to regenerate the code folding state of the method when it imports the class JSON.
Word Wrapping
Long lines of code displayed in the Code Editor will wrap onto the next line automatically, and the text that wraps is drawn with an indent to make it clear that it belongs to the wrapped line (you can disable this behavior, so code lines are not wrapped, which corresponds to behavior in versions prior to Studio 10.2).
The Word Wrap option on the View menu of the method editor and remote debugger windows allows you to toggle Word wrapping; the option is turned on by default, and the state is saved with the window setup. When Word Wrap is enabled there is no horizontal scrollbar in the code editor window and long code lines wrap to the next line at suitable break characters, or they wrap if there is no break character.
For method content tooltips, word wrapping is always on, irrespective of the setting in the window for which the tooltip is being generated.
When word wrap is turned on and the Code editor encounters an inline comment, it tries to shrink the gap between the end of the code line and the inline comment to avoid wrapping the code line if possible: if the inline comment is still too long to fit onto the line it will wrap onto the next line, under the code line and is displayed indented.
Setting Breakpoints
You can set a Breakpoint, a One-time breakpoint or the Go Point using the pointer (to click on the code margin) and the keyboard:
You can set a Breakpoint using a single click in the left margin of the code editor, next to any line of code where you want the breakpoint.
You can set a One-time breakpoint using Ctrl/Cmnd+click next to the line of code
You can set the Go point using Shift+click next to the line of code
(Existing users should note that you can no longer set the Go point by double-clicking in the left-hand margin.)
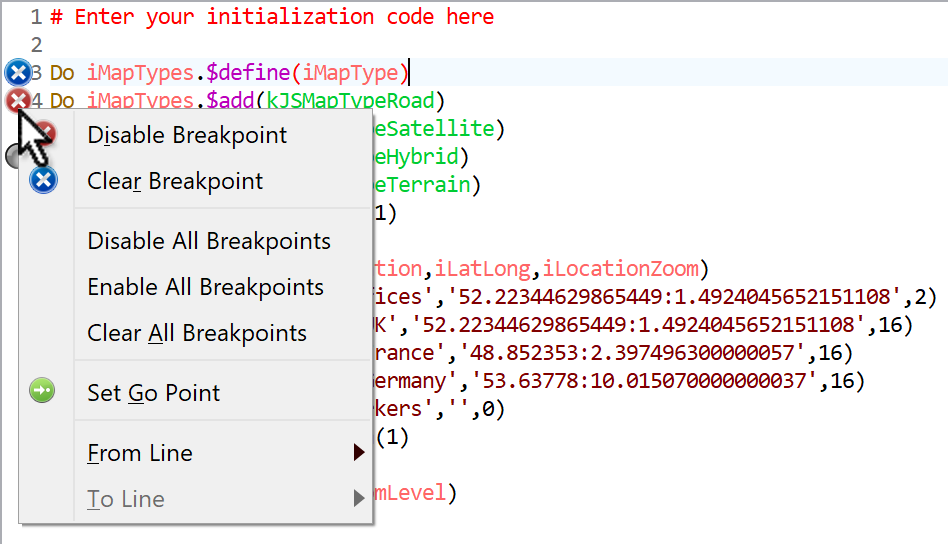
Alternatively, you can use the Breakpoint context menu by right-clicking in the left margin of the code editor, next to any line of code, and selecting the option.
In addition, the Breakpoint context menu shows Delete and Disable/Enable breakpoint commands when there is a breakpoint already set for the line. It also shows the commands to Clear/Disable/Enable all breakpoints. And if there is an active stack, as well as set Go point, there is a command to Clear the stack.
Conditional Breakpoints
The Set Condition... option in the Breakpoint context menu (and the Breakpoints toolbar menu or Breakpoint list context menu) allows you to add conditions or a hit count to Breakpoints. You can enter a calculation that must evaluate to true (non-zero) for the breakpoint to be hit, and/or a number of hits that are to be ignored before the breakpoint is hit. The calculation and/or ignore count is displayed in parentheses in the breakpoint list.
The remote debugger displays the remote debug breakpoint, although it does not include a hit count.
The #DEBUGGER system table stores the current local debugger code breakpoint locations, which means code breakpoints (and their conditions) are restored when a library is reopened. #DEBUGGER does not appear in the Studio Browser class list, but it is included in $clib.$classes.
Menus and Keyboard Shortcuts
The Method Editor menus have been re-worked and improved for Studio 10 and include several new commands or options. The keyboard shortcut keys for some options have changed and these are listed below where they occur – there is a summary of the keyboard shortcuts at the end of this section. Where there are significant changes, an image of the menu from Studio 8 and Studio 10 is shown, so you can compare them.
The View menu in the Method Editor has several changes or additions: some of the new options are discussed elsewhere. The Show Debug Palette and Show Chroma Coding options have been removed: the latter option has been replaced by a more comprehensive set of color options stored in the default theme in the IDE (you can change the theme in the Studio Browser Hub under Options, including a dark theme which may be more suited to working in the code editor).
Goto Panel
The Goto Panel option on the View menu lets you select a different pane in the Variables list (with keyboard shortcuts Ctrl+0 to 5). It also lets you switch the insertion point to the Code text entry area (Ctrl+7) ready to enter some code, or back to the Method Tree list from the code entry area (Ctrl+8).
The Debug menu lets you run the current method via the Execute Method option, or test the current Remote form (or window) using the Test Form option.
Next are the debug options for Go, Step, Step Over, and Trace, plus you can Set Go Point from the Debug menu (or press Shift+F2), or use the From Line, To Line or Step Out options. The same options are available in the debug toolbar at the top of the code editing area.
As your code executes the debugger will scroll automatically to the center of the code entry area when the current line is positioned at around 75% of the visible lines.
The Break On <event> option allows you to select which events will stop the debugger while debugging remote form and window instances. (note IDE windows do not cause a break).
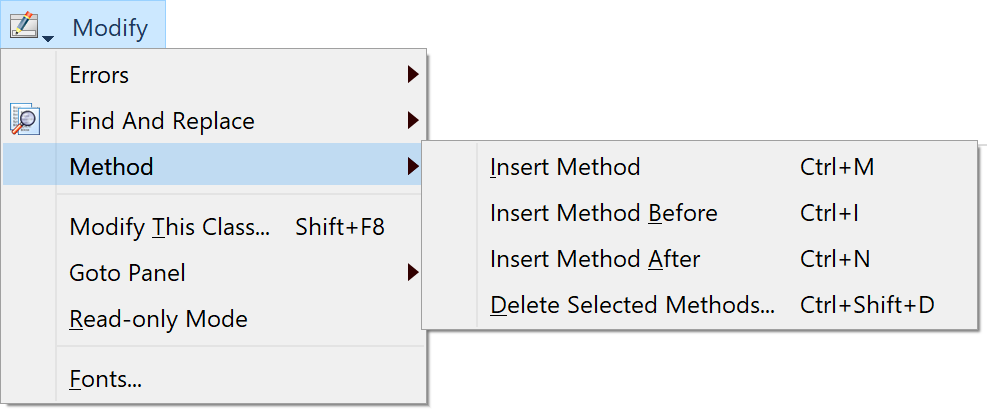
The Modify menu contains new submenus for Errors and Find And Replace. The Execute Method option has been moved to the Debug menu, while the Goto panel and Fonts options have been moved to the View menu. The various Line options have been moved to the Line submenu.
The Comment & Uncomment options have been merged and moved to the Selection submenu. For classes which have an associated editor, the Modify This Class option opens the class editor, such as a JavaScript remote form: the shortcut key is Shift+F8.
There are additional entries that depend on the focus, as follows.
- If the focus is on the Method Tree (on the left, containing a list of methods for the class), the Modify menu contains a submenu called Method, which allows you to Insert Method (at the end of the method list, or Before or After the current method), or Delete Selected Methods
- If the focus is on the Code text entry area (on the right), the Modify menu contains submenus called Line and Selection: see later in this section for info.
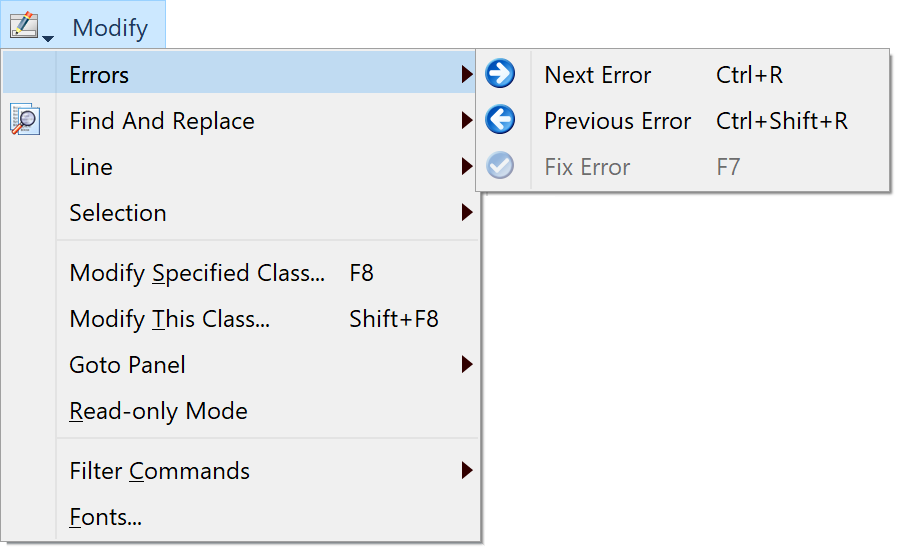
The Modify>>Errors submenu is new and contains Next error, Previous error and Fix error commands, that can be used instead of the buttons on the editor panel. These also have keyboard shortcuts.
Note that when the focus is on the method tree, this menu is only present when only one method is selected.
Find And Replace Menu
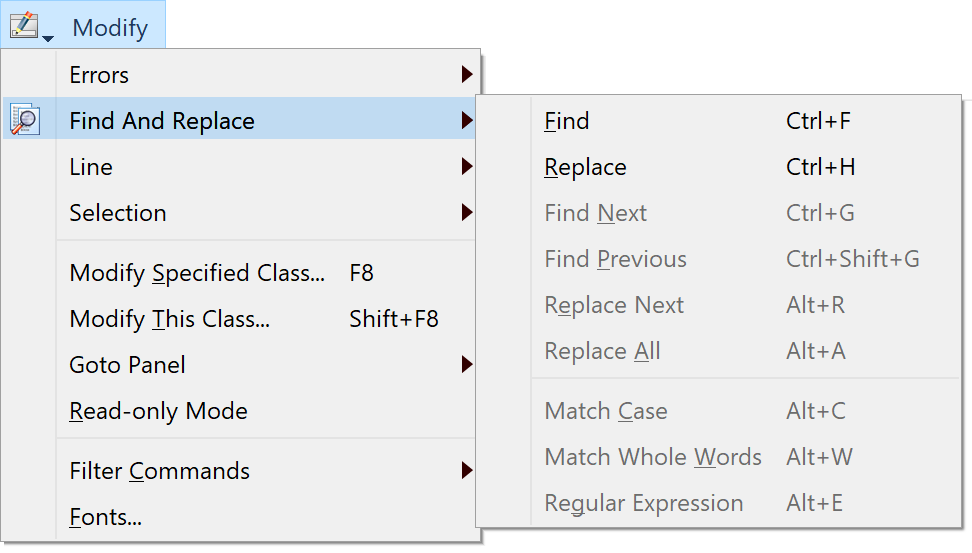
The Modify>>Find and Replace submenu allows you to perform a local find and replace on the method text for the current selected method in the Code Editor. Note that when the focus is on the method tree, this menu is only present when only one method is selected. This menu also allows you to toggle options such as match case.
The menu commands also have keyboard shortcuts, that is, Ctrl+F opens the Find panel, Ctrl+H opens Find and Replace, or Ctrl+G finds next. When you first select the Find or Replace command, the editor opens a panel immediately above the code entry field, where you can enter the find (and replace) text.
The panel also contains Search buttons that perform the same operations as the menu items, as follows:
| Match case |
Alt+C |
| Match whole words |
Alt+W |
| Use regular expressions |
Alt+E |
| Find Next or Previous |
Ctrl+G or Ctrl+Shift+G
(to Find Previous, you can shift click the button) |
| Replace next |
Alt+R |
| Replace all |
Alt+A |
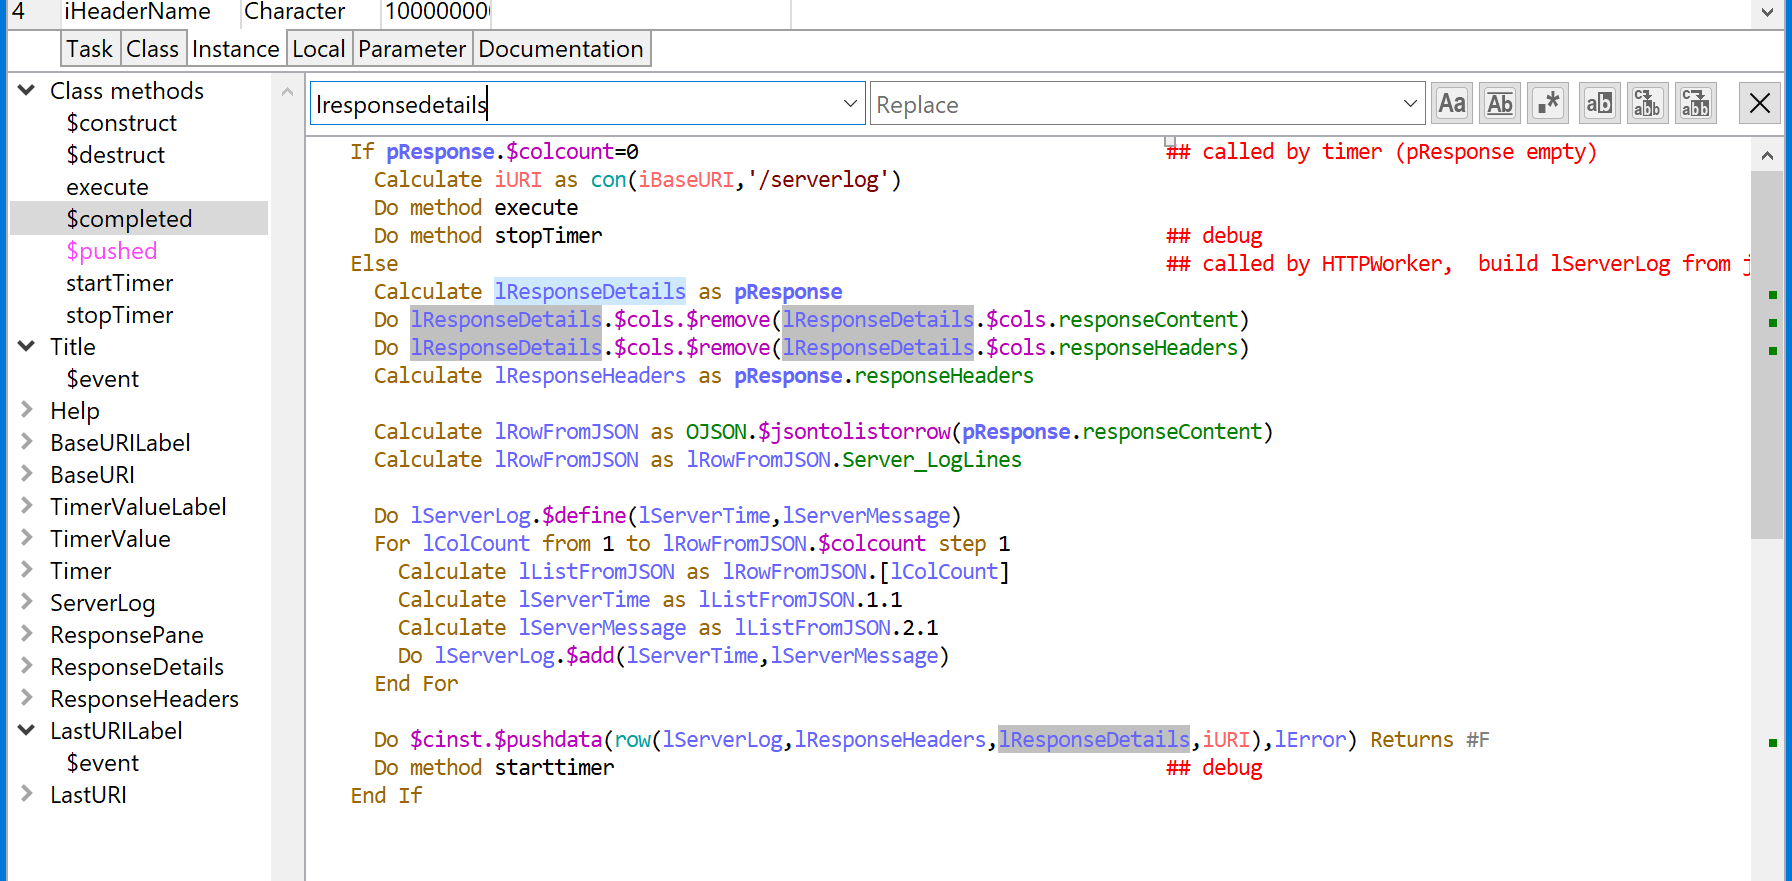
As you type characters into the find text field, the code text area dynamically updates to reflect the found text. It highlights the found text, and it also adds a green marker to the vertical scrollbar, in a similar way to the error marker, drawn to the right of the error marker, e.g. the text ‘lresponsedetails’ is searched and highlighted in the above image.
After closing the Find (or Find and Replace) panel, you can still use Find Next and Find Previous, although the editor no longer highlights all matches.
Jump to Search or Error Item
On Windows, you can Ctrl-click in the scrollbar to jump to that position in the code text, i.e. Ctrl-clicking on a find or error marker goes to the search item or error in the code text. On macOS, the general system preference for scrolling can be set to Jump to the position that has been clicked, or you can Alt+click to achieve the same thing.
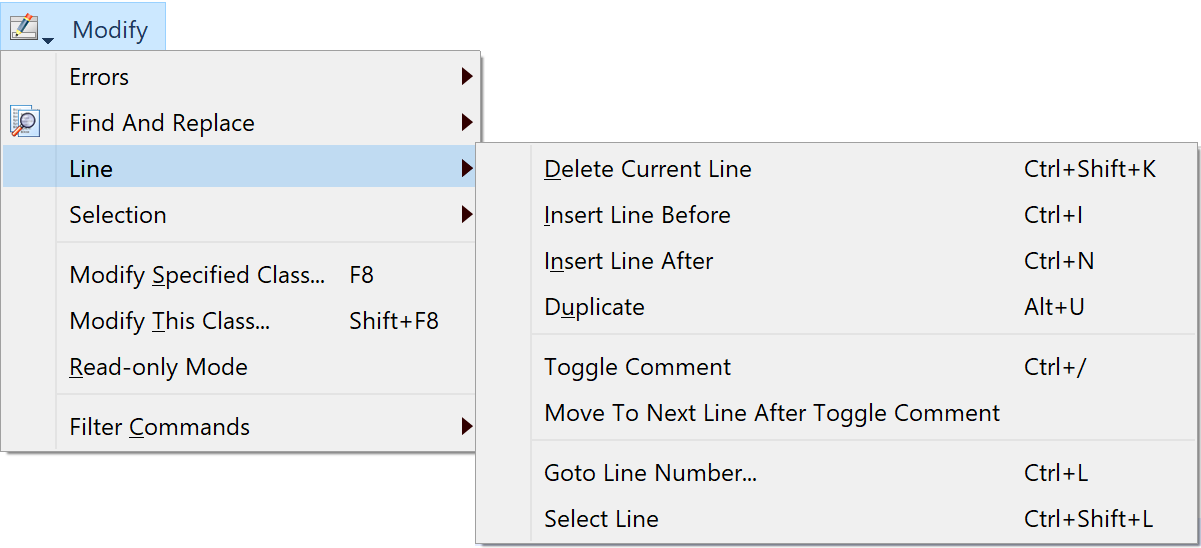
The options in the Line submenu replace several options in the Modify menu in previous versions, including Insert Line After, Insert Line Before, and Toggle Comment. Note that you can Right-click on the current or selected lines of code to open a context menu with similar options.
The Comment and Uncomment line options available in previous versions have been merged into a single Toggle Comment command, which has the single keyboard shortcut Ctrl+/ for commenting or uncommenting lines.
The Line Menu contains the new option Select Line which selects all the text in the current line (triple-clicking on a line also selects the line), and the Delete Current Line option which deletes the current line (containing the cursor or word selection), or all lines where multiple lines are selected.
The Duplicate option duplicates the current line (if no text is selected) or all selected lines, and places the duplicate line(s) immediately below the original line(s). The command also selects the duplicate text, which then allows you to use repeated Duplicate commands to generate multiple copies.
The Goto Line Number option opens a box to allow you to enter a line number to go to. You can show line numbers in the code area using the Show Line Numbers option in the View menu.
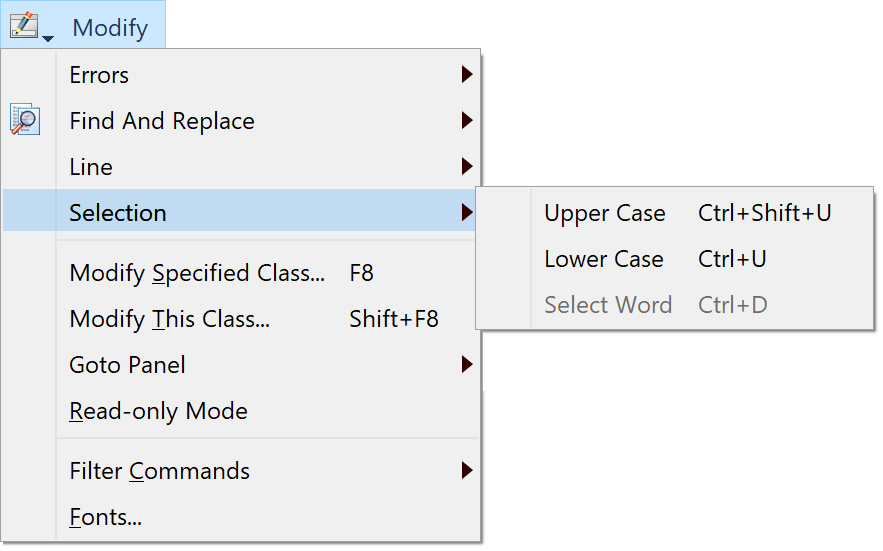
The Modify>>Selection submenu contains new commands Upper Case and Lower Case: note that these options only change case for text that does not have a single canonical form, e.g. text in strings.
In addition, the Selection submenu contains the option Select Word which selects the word containing the insertion point, or where the insertion point is at the beginning or end of a word: in the latter case the word to the right or left of the insertion point is selected.
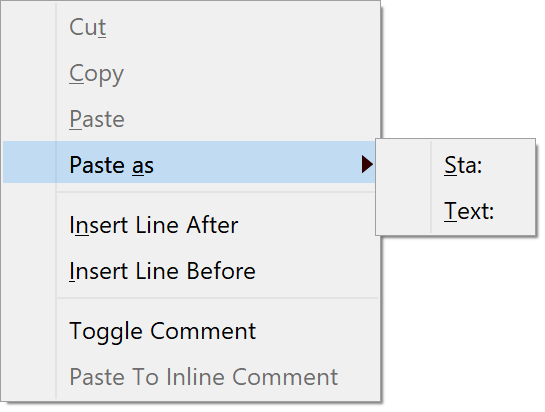
The Method Editor context menu (opened when you right-click on the Code text area) has a new hierarchical menu called Paste as. You can use this to paste multiple lines of text from the clipboard into Sta:, Text: or JavaScript: commands. The Paste as hierarchical menu items are enabled when the caret is positioned on an empty line.
Keyboard Shortcuts
There are many keyboard shortcuts to allow you write Omnis code from the keyboard alone, without having to use the pointer. The most significant menu options in the Method Editor have keyboard shortcuts, including most of the options in the Modify and Debug menus, as well as the Find and Replace options.
The following keyboard shortcuts are available, but you should be aware that several of them are context specific so will only work if the focus is on a certain area in the Method Editor.
| Alt+A |
Cmnd+Opt+A |
Replace all in method |
replaceAllInMethod |
| Alt+B |
Cmnd+Opt+B |
Disable breakpoint |
disableBreakpoint |
| Alt+C |
Cmnd+Opt+C |
Match case |
matchCase |
| Alt+E |
Cmnd+Opt+E |
Enable breakpoint |
enableBreakpoint |
| Alt+F |
Cmnd+Opt+F |
Disable all breakpoints |
disableAllBreakpoints |
| Alt+G |
Cmnd+Opt+G |
Enable all breakpoints |
enableAllBreakpoints |
| Alt+H |
Cmnd+Opt+H |
Open Edit helper dialog |
openEditHelperDialog |
| Alt+I |
Cmnd+Opt+I |
Debugger interrupt |
debuggerInterrupt |
| Alt+J |
Cmnd+Opt+J |
Set list selection |
setListSelection |
| Alt+K |
Cmnd+Opt+K |
Clear method stack |
clearMethodStack |
| Alt+L |
Cmnd+Opt+L |
Set list current line |
setListCurrentLine |
| Alt+M |
Cmnd+Opt+M |
Toggle read-only mode |
toggleReadOnlyMode |
| Alt+N |
Cmnd+Opt+N |
Toggle null and empty |
toggleNullAndEmpty |
| Alt+R |
Cmnd+Opt+R |
Replace next in method |
replaceNextInMethod |
| Alt+S |
Cmnd+Opt+S |
Save modified variable |
saveModifiedVariable |
| Alt+T |
Cmnd+Opt+T |
Set breakpoint condition |
setBreakpointCondition |
| Alt+U |
Cmnd+Opt+U |
Duplicate line |
duplicateLine |
| Alt+V |
Cmnd+Opt+V |
Go to debugger variables |
gotoDebuggerVariables |
| Alt+W |
Cmnd+Opt+W |
Whole words |
wholeWords |
| Alt+X |
Cmnd+Opt+X |
Regular expression |
regularExpression |
| Alt+Y |
Cmnd+Opt+Y |
Side by side |
sideBySide |
| Alt+Z |
Cmnd+Opt+Z |
Binary edit operations |
binaryEditOperations |
| Ctrl+/ |
Cmnd+/ |
Toggle comment |
toggleComment |
| Ctrl+[ |
Cmnd+[ |
Move up stack |
moveUpStack |
| Ctrl+] |
Cmnd+] |
Move down stack |
moveDownStack |
| Ctrl+0 |
Cmnd+Opt+0 |
Go to task variables |
gotoTaskVariables |
| Ctrl+1 |
Cmnd+Opt+1 |
Go to class variables |
gotoClassVariables |
| Ctrl+2 |
Cmnd+Opt+2 |
Go to instance variables |
gotoInstanceVariables |
| Ctrl+3 |
Cmnd+Opt+3 |
Go to local variables |
gotoLocalVariables |
| Ctrl+4 |
Cmnd+Opt+4 |
Go to parameters |
gotoParameters |
| Ctrl+5 |
Cmnd+Opt+5 |
Go to documentation |
gotoDocumentation |
| Ctrl+6 |
Cmnd+Opt+6 |
Go to RESTful panel |
gotoRESTfulPanel |
| Ctrl+7 |
Cmnd+Opt+7 |
Go to code |
gotoCode |
| Ctrl+8 |
Cmnd+Opt+8 |
Go to method tree |
gotoMethodTree |
| Ctrl+D |
Cmnd+D |
Select word |
selectWord |
| Ctrl+E |
Cmnd+E |
Execute method |
executeMethod |
| Ctrl+F |
Cmnd+F |
Find in method |
findInMethod |
| Ctrl+G |
Cmnd+G |
Find next in method |
findNextInMethod |
| Ctrl+H |
Cmnd+H |
Replace in method |
replaceInMethod |
| Ctrl+I |
Cmnd+I |
Insert before |
insertBefore |
| Ctrl+L |
Cmnd+L |
Go to line number |
gotoLineNumber |
| Ctrl+M |
Cmnd+M |
Insert method at end |
insertMethodAtEnd |
| Ctrl+N |
Cmnd+N |
Insert after |
insertAfter |
| Ctrl+R |
Cmnd+R |
Next error |
nextError |
| Ctrl+U |
Cmnd+U |
Lower case selection |
lowerCaseSelection |
| Ctrl+Shift+B |
Cmnd+Shift+B |
Toggle breakpoint |
toggleBreakpoint |
| Ctrl+Shift+C |
Cmnd+Shift+C |
Clear code breakpoints |
clearCodeBreakpoints |
| Ctrl+Shift+D |
Cmnd+Shift+D |
Delete selected methods |
deleteSelectedMethods |
| Ctrl+Shift+E |
Cmnd+Shift+E |
Trace |
trace |
| Ctrl+Shift+G |
Cmnd+Shift+G |
Find previous in method |
findPreviousInMethod |
| Ctrl+Shift+I |
Cmnd+Shift+I |
Inherit and override method |
inheritAndOverrideMethod |
| Ctrl+Shift+J |
Cmnd+Shift+J |
Clear variable breakpoints |
clearVariableBreakpoints |
| Ctrl+Shift+K |
Cmnd+Shift+K |
Delete current line |
deleteCurrentLine |
| Ctrl+Shift+L |
Cmnd+Shift+L |
Select line |
selectLine |
| Ctrl+Shift+M |
Cmnd+Shift+M |
Superclass methods |
superclassMethods |
| Ctrl+Shift+N |
Cmnd+Shift+N |
Show method tree |
showMethodTree |
| Ctrl+Shift+O |
Cmnd+Shift+O |
Toggle one-time breakpoint |
toggleOneTimeBreakpoint |
| Ctrl+Shift+R |
Cmnd+Shift+R |
Previous error |
previousError |
| Ctrl+Shift+S |
Cmnd+Shift+S |
Step |
step |
| Ctrl+Shift+T |
Cmnd+Shift+T |
Step out |
stepOut |
| Ctrl+Shift+U |
Cmnd+Shift+U |
Upper case selection |
upperCaseSelection |
| Ctrl+Shift+V |
Cmnd+Shift+V |
Step over |
stepOver |
| F1 |
F1 |
Opens the Omnis Help using the syntax item under the pointer |
(Not configurable) |
| F3 |
F3 |
Modify this class |
modifyThisClass |
| F5 |
F5 |
Go point |
go |
| F7 |
F7 |
Fix error |
fixError |
| F8 |
F8 |
Modify specified class |
modifySpecifiedClass |
| F10 |
F10 |
Method history backwards |
methodHistoryBackwards |
| Shift+F1 |
Shift+F1 |
Opens the Omnis Help using the syntax item under the pointer |
(Not configurable) |
| Shift+F2 |
Shift+F2 |
Set Go point |
setGoPoint |
| Shift+F4 |
Shift+F4 |
Pin bottom panel |
pinBottomPanel |
| Shift+F5 |
Shift+F5 |
Hide bottom panel |
hideBottomPanel |
| Shift+F6 |
Shift+F6 |
Show editor panel |
showEditorPanel |
| Shift+F7 |
Shift+F7 |
Show debug panel |
showDebugPanel |
| Shift+F9 |
Shift+F9 |
Show Variable panel |
showVariablePanel |
| Shift+F10 |
Shift+F10 |
Method history forwards |
methodHistoryForwards |
Keyboard Shortcut Configuration
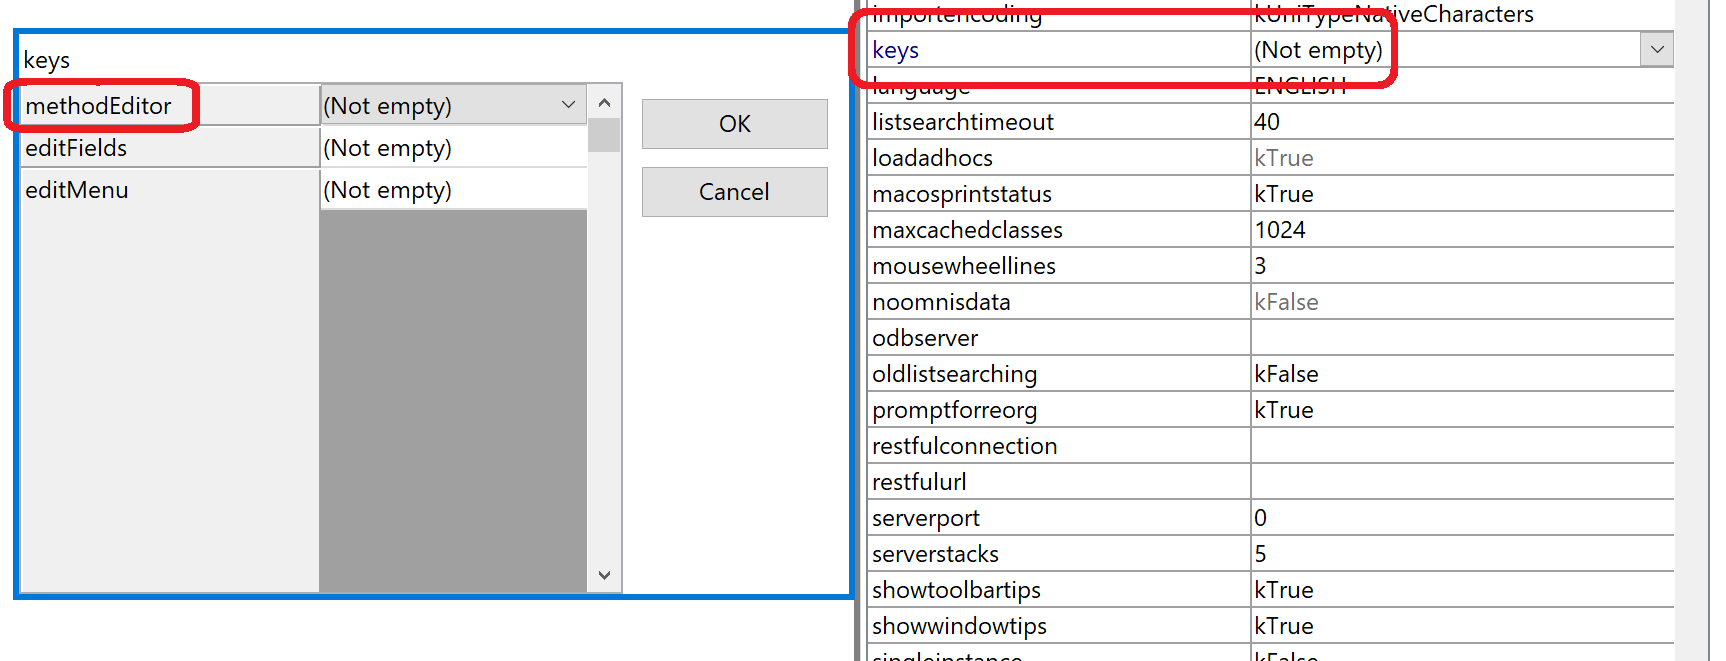
The keyboard shortcuts are stored in the $keys property in the Omnis Preferences ($prefs), which you can edit in the Property Manager to change the keyboard shortcuts. Note this feature replaces the Edit Keys option on the Debug menu in previous versions, and it also contains the keyboard shortcuts for Edit fields and the Edit menu.
The first time you edit $keys and press OK, Omnis generates a file called keys.json in the Studio folder, that records the configuration of the keyboard shortcuts (as listed above): if you don’t make any changes in $keys the default keyboard shortcuts will be stored in keys.json.
You can edit the Shortcut Keys options by selecting $keys in the Property Manager (find it under the Omnis Preferences in the Studio Browser), then select ‘methodEditorAndRemoteDebugger’.
To edit a value, you can use the Delete or Backspace key to clear the current shortcut, and then type the desired shortcut key combination. You can use all the standard Key modifiers (Ctrl, Cmnd, Alt, Option, Shift, etc) as well as all the letter and number keys, plus the numbered Function keys. In addition, you can use the Enter and Return keys in conjunction with Ctrl/Cmnd, and optionally Shift or Alt/Option, for method editor menu shortcuts.
The $keys preference also contains the shortcut keys for Edit fields (editFields), which are documented under the JavaScript Edit Control, and the Edit menu (editMenu) which has the following shortcut keys:
| Ctrl+Y |
Redo last operation |
Redo |
| Ctrl+Shift+F |
Find and Replace |
findAndReplace |
| Ctrl+Shift+G |
Find Next |
findNext |
Word Selection
You can double-click on a word to select it, or double-click and drag the pointer to select multiple words. If you double-click on a single word that is enclosed in quotes (e.g. like the foo in Calculate lcVar as "foo"), the quotes will not be selected. In previous versions the quotes would have been selected, but if want to enable the old behavior you can set a new option "entryFieldsIncludeQuotesWhenSelectingWords" in the "defaults" section of config.json to true: the option defaults to false which enables the new behaviour.
You can comment or uncomment a single method line by clicking anywhere in the line (or you can select the whole line) and selecting the Toggle Comment option, or press the Ctrl+/ shortcut. To comment or uncomment multiple lines, you need to select all the lines and then use the Toggle Comment option: in this case, all the affected lines will remain selected after toggling their comment state. Commenting a single empty line does not select the commented line: in this case (and when "Move to next line after toggle comment" is off, see below), the caret is positioned after the comment character and the space, ready for you to type the comment.
You can force the cursor to move down to the line after the commented/uncommented line or block of selected lines by enabling the Move To Next Line After Toggle Comment option in the Line menu (the option is off by default): the state of this option is saved with the Window Setup.
Empty method lines are not commented out when using the Toggle comment command or Shortcut key: this applies when multiple selected lines may include empty lines.
Language Syntax
There are a number of changes to the Omnis language syntax that facilitate direct text entry of commands, and which enable the new Omnis Studio 10.0 language parser to function properly.
Language Keywords
The following language keywords cannot be used as variable names:
| as |
at |
flag |
| for |
from |
into |
| on |
returns |
sec |
| step |
to |
until |
During library conversion (to Studio 10 or above), any variable names using these keywords are appended with an integer starting at 1.
Options
Omnis stores the order in which “checkbox” and “radio button” command options are specified as part of the method command (remember that the Omnis language is tokenized, and does not store raw text as entered by the developer). This allows you to enter the options as text in any order.
The “Select matches (OR)” and “Deselect non-matches (AND)” options of the Search list command have been renamed to “Select matches OR” and “Deselect non-matches AND”. This prevents the parentheses in these option names from interfering with language parsing.
Braces
Braces have been removed from all commands, except for commands like OK message, which require three components (a field name or square bracket calculation, options and a calculation). For these commands, when they use square bracket calculations, you must escape ( ) { } characters in the calculation outside square brackets if there is no text after the parentheses. In this case, these characters need to be escaped using square bracket notation, e.g. [‘(‘] escapes (.
Entering Quotes, Braces, and Square Brackets
When you have used an opening quote, or an open brace {, and then typed some parameters, the Code Editor adds the appropriate closing character.
However, when entering an open square bracket in the Sta: command, the close square bracket (]) is not added automatically.
When you split a text block command parameter using Return (carriage return) the “Sta:” command prefix is inserted into the text block automatically.
Text: and parenthesis
If Omnis encounters an open bracket ( at the end of a command line, it prompts for options (Carriage return etc). If there is another character after the (, without a trailing comma, Omnis stops looking for options, and treats the characters as text. This leaves the special case of ( on its own at the end of the text. You can enter this using square bracket notation with a constant [kOpenParen]. There is also a kCloseParen constant.
Unicode Characters
The Code Editor selects a smaller font size, if necessary, for all Unicode characters >= 0x250 contained in a string. On retina displays (on Win and macOS), the Code Editor uses the default font. On non-retina displays, it may be necessary to increase the font size to get a reasonable display of Unicode characters.
Character Constants
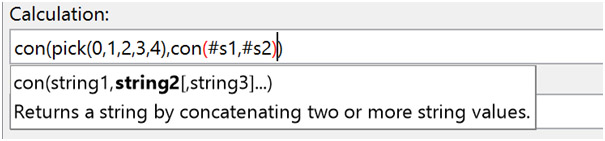
You can insert the # character, as well as left and right square bracket into a string/text using the constants kHash, kLeftSB and kRightSB. If you wish to create a constant for double hash, you can initialise a variable with the value con(kHash,kHash).
To enter a new comment on an empty line, you can type # and then the comment text, with or without a space after the #. (For backwards compatibility, you can also type ; to create a new comment, but the comment is marked with #).
To enter an inline comment, press the space key followed by ## at the end of a code line, and then enter the comment text. Inline comments are positioned over on the right of the code entry area: they are left-tab aligned according to a tab which is indicated by a small marker at the top of the code entry area: you can drag this marker to reset the tab position.
The Sta:, Text: and JavaScript: commands (that generate a text block) no longer allow inline comments (see note in Library Conversion section about inline comments for the Sta: command). This allows all text after a colon to be treated as significant text, and to be added to the text block, with the exception of the options string specifying the line delimiter for the Text: command.
If you want to include “space##” in a string you need to enter <space>## in the string and it will not be interpreted as an inline comment.
You can “comment” or “uncomment” the current method line (containing the cursor) or any selected method line or lines using the Toggle Comment option in the Modify menu, or using the keyboard shortcut Ctrl-/ (forward slash) – note the same menu option or keypress can be used to both comment or uncomment method lines or comments as appropriate. Commented lines must have valid syntax to be uncommented, otherwise they will remain commented out.
Errors
As the new Method Editor allows any text to be entered, it is possible to enter and store commands that contain errors. Internally, these are stored in the method with a new command type, and will cause an error to be reported if you try to export the method to JSON, or if you try to execute them.
The Find and replace dialog has a new option (Only search method lines containing an error), which you can use to find commands with an error. When you check this option, the dialog also checks the regular expression option, and sets the find string to the regular expression “.*”.
In general, there should not be much need to leave erroneous commands stored in a method for very long - the editor gives immediate feedback about errors, so in practice it makes sense to fix them as you code. The Find and replace dialog option provides a means to double check that all is well with a library. Omnis Studio 10.0 takes this approach (rather than for example marking all classes with an error count) since errors should be very much an exceptional case once coding of a method is complete.
Modified Commands
The step interval for the For command is assumed to be 1, so when entering a For loop and you want the step interval to be 1, you no longer need to enter this. If you need a step interval other than 1 you need to enter this into your code.
Obsolete Commands
Any commands that were marked as ‘Obsolete Commands’ in previous versions (listed in the ‘Obsolete Commands…’ group) have been removed from the Omnis language and are shown commented out in your Omnis code. The Translate input/output command is also obsolete and will be commented out.
The Call method OBSOLETE COMMAND will be replaced by the Do code method command and the method name.
There is a complete list of obsolete commands that have been deleted in this version in Appendix A in this manual.
Library Conversion
The changes in language syntax mean that Omnis performs a class-by-class conversion of a library created using Omnis Studio 8.1.x or earlier. The following items are converted:
Any obsolete commands are commented out. In previous versions these commands were marked with the “OBSOLETE COMMAND” suffix and listed in the ‘Obsolete commands’ group, and some of these commands have been removed from Omnis, so cannot be used in your code. The Appendix in this manual lists all of the obsolete commands that have been removed in Studio 10.x or above and will be commented out.
The prefix for comments is now #, converted from ;
A space is inserted after the # at the start of comments, therefore comments are # abc rather than #abc after conversion.
Inline comments for JavaScript:, Text:, and Sta: commands are no longer allowed, since all the text after the : is treated as part of the statement or text. Therefore, on conversion, all inline comments are moved to the next line and inserted as a standard comment (see below).
Square bracket calculations (ctySquare, ctyParmlist4 etc) are converted so that any text outside square brackets does not contain unescaped characters () {}.
Any instances of " ##" are detected in method lines and reported as a warning (they are probably not editable as the parser will treat the text after this sequence as the inline comment).
Any variables which are named using a language keyword (see earlier for a list) are renamed, by appending an integer to them (starting with 1 until a new unique name in its context is created).
Inline Comments for JavaScript:, Text: and Sta: commands
By default, the conversion process will move all inline comments from JavaScript:, Text: and Sta: commands to the next line in the method, after the original line containing the inline comment. There are three new options in the "ide" section of config.json to allow you to control how inline comments are treated.
"libConverterAppendsDiscardedInlineComments"
When true (the default), if the inline comment would otherwise be discarded, the converter appends a comment command after the JavaScript:, Text: or Sta: command, containing the inline comment.
"libConverterAddsInlineCommentToStaCommandParameter"
Note that if you use "libConverterAddsInlineCommentToStaCommandParameter" to convert inline comments for Sta: commands, then this option will not affect Sta: commands: see below.
“libConverterInsertsDiscardedInlineComments”
moves and inserts the inline comment before the original line containing the inline comment (however, if libConverterAppendsDiscardedInlineComments is set to true, libConverterInsertsDiscardedInlineComments is ignored).
If you want to keep inline comments as part of the SQL text for Sta: commands, you can set the item “libConverterAddsInlineCommentToStaCommandParameter” in the ‘ide’ section of config.json to a formatting string, e.g. " -- %" or " /* % */". Omnis replaces the first % place-holder in the formatting string with the inline comment, and appends the resulting string to the parameter of the Sta: command. Note that if the resulting text does not tokenize, e.g. if the inline comment contains text like [#S333] which does not tokenize, then the comment will be discarded.
If you leave “libConverterAddsInlineCommentToStaCommandParameter” empty (or supply a string that does not include the % character), then Omnis will discard the inline comment when converting Sta: commands.
SQL comments for the Sta: command are colored, including /* */ and – comments. The “syntaxColorProbableSQLComments” option in the ‘ide’ section of config.json is enabled by default, but can be set to kFalse to disable coloring.
Call Method OBSOLETE COMMAND
The Call method OBSOLETE COMMAND is converted to the Do code method command during conversion.
Set return value OBSOLETE COMMAND
During conversion, consecutive Set return value OBSOLETE COMMAND value and Quit method commands (the latter with an empty parameter) are combined into a single command Quit method value. Note that when checking for consecutive commands, Omnis skips comments and empty lines.
Library Conversion Logs
The converter adds an entry to the Find and Replace log that allows you to quickly navigate to each change made by the converter by double-clicking on a line in the log. In addition, the converter writes a log file to the ‘conversion’ folder in the logs folder in the data part of the Studio tree. The log file provides a more permanent record of the changes applied to the converted library. Note that Omnis does not write log entries to record where spaces were inserted at the start of comments.
JSON generated libraries
When Studio 10 imports JSON generated with Studio 8.1, it parses methods using the old Studio 8.1 parser, and then applies the same conversion steps as above to the imported classes. Changes applied by this conversion are written to the Find and Replace log only.
Method Editor Coloring
The colors used in the Method Editor window can be changed by changing the theme in the Hub>>Options in the Studio Browser, or configured by editing the $appearance preference in the Property Manager (these are stored in appearance.json and the various theme files): the method editor colors are stored in the IDEmethodEditor group in the appearance.json file. The following theme colors (and settings) are available:
| methodcurrentlinebackgroundcolor |
The background color used to display the line containing the caret in the Method Editor |
| methodeditorcodebackgroundcolor |
The background color for the method editor code area |
| methodeditorcodereadonlybackgroundcolor |
The background color for the method editor code area in read-only mode |
| methodeditorcodeleftmarginbackgroundcolor |
The background color for the left margin in the Code Editor (where the Go point and breakpoints are shown) |
| methodhighlightcolor |
The color of selected method text in the Method Editor when the control displaying the method text has the focus |
| methodhighlightnofocuscolor |
The color of selected method text in the Method Editor when the control displaying the method text does not have the focus |
| methodeditorfadealpha |
Value 0-255; the fade level of the method editor when editing a variable value in the debugger variable panel |
| overriddenmethodstyle |
Overridden method style |
| overriddenbuiltinmethodstyle |
Overridden built-in method style |
| syntaxwordhighlightcolor |
Color used to highlight syntax elements, e.g. click on a variable name in the code editor to highlight all mentions of the variable |
| codeassistantpopupcolor |
Background color of Code assistant popup |
| treelinesmatchingsearchcolor |
Background color of unselected method editor tree lines that match the current method search |
| executionpositioncolor |
A line is drawn above and below the Go point line and Call stack return point using this color |
Syntax Coloring
The colors used in the Chroma Coding or code syntax in the Method Editor can be changed by changing the theme in the Hub>>Options in the Studio Browser, or configured by editing the $appearance preference in the Property Manager (these are stored in appearance.json and the various theme files): the method syntax colors are stored in the IDEmethodSyntax group in the appearance.json file. The following theme colors (and settings) are available:
| badsyntaxcolor |
bad method syntax indicators |
bracketbackcolor
bracketcolor |
Brackets color and background color |
classvariablecolor
classvairablestyle |
Class variables |
commentcolor
commentstyle |
Comments |
constantcolor
constantstyle |
Constants (e.g. kTrue) |
ctrlkeywordcolor
ctrlkeywordstyle |
Ctrl keyword |
currentblockcolor
currentblockstyle |
Current block |
eventparametercolor
eventparameterstyle |
Event parameter variables |
functioncolor
functionstyle |
Built-in and external functions |
hashvariablecolor
hashvariablestyle |
Hash variables |
instancevariablecolor
instancevariablestyle |
Instance variables |
keywordcolor
keywordstyle |
Keywords |
localvariablecolor
localvariablestyle |
Local variables |
| methodothertextcolor |
Color for all other text with no specific syntax color, e.g. separators, dots, etc. |
notationcolor
notationstyle |
Built-in notation attributes |
optioncolor
optionstyle |
Command options (e.g. Sound bell for OK message; corresponding to check boxes or radio buttons in the pre-Studio 10 editor) |
parametervariablecolor
parametervariablestyle |
Method parameter variables |
resolvednamecolor
resolvednamestyle
unesolvednamecolor
unresolvednamestyle
useresolvednamecolorsandstyles |
Field names and parameters that are “resolved” or “unresolved”; see below |
stringcolor
stringstyle |
Strings |
taskvariablecolor
taskvariablestyle |
Task variables |
variablecolor
variablestyle |
Color for other variables, including file class variables (field names), and other components of a variable string, e.g. a list column name |
Syntax Highlighting
When you click in a syntax element (variable, notation name, command name (not block commands) or function name), the code editor performs a find and highlights instances of the element in the current method (note the find highlighting will override the syntax highlighting if the Find or Find and Replace panel is displayed).
The view menu contains the option “Highlight Syntax Words” which is checked by default. There is a new color option"syntaxwordhighlightcolor” in the “IDEmethodEditor” group in the $appearance Omnis preference, and stored in the appearance.json file.
Resolved Name Colors
There are colors and styles to highlight field names and parameters that are “resolved” or “unresolved” for certain commands that reference field names and notation group members. The Code Editor can (defaults to on) display names it has resolved using resolvednamecolor and resolvednamestyle, and names it has failed to resolve using unresolvednamecolor and unresolvednamestyle; all members are in the IDEmethodSyntax section of appearance.json.
If useresolvednamecolorsandstyles is true, the Code Editor tries to resolve certain names, and if successful draws them using the resolvedname color and style; if unsuccessful it draws them using the unresolvedname color and style.
Examples of where this applies are the parameters of the Redraw command, Queue set current field command, names in notation such as $cinst.$objs.name, and method names in calls such as $cinst.$mymethod().
If a name is displayed using the unresolvedname color and style it does not necessarily mean there is an issue, e.g. it could be a notation reference such as $cinst.$objs.name, where the object is dynamically added and named at runtime.
JavaScript: Editor
In addition to the main interface changes in the Method Editor, a JavaScript editor has been added to the Method Editor in Studio 10 to allow you to enter a whole block of JavaScript code directly into the JavaScript: command, rather than line by line as in previous versions. The new JavaScript editor will popup whenever you edit a command line containing the JavaScript: command. The editor also allows you to enter a SQL statement if the Sta: command is selected: in this case, the editor will switch to SQL mode.
To edit or enter some JavaScript, click into or tab to a JavaScript: command line in the text entry panel, or select a whole JavaScript: command line or multiple lines, and either
Press Alt+H to open the JavaScript editor, which in this case is the same as clicking on the Helper dialog button at the bottom of the Method Editor window
Or select Open JavaScript Editor from the Modify>>Selection submenu
The content of the JavaScript editor is formed by concatenating the contiguous JavaScript: command(s) that are selected in the list. This allows you to edit or insert a contiguous sequence of these commands as a block. Omnis selects unselected lines in this contiguous block when it opens the window, so all the lines are selected when viewed behind the editor window. When you have finished editing the JavaScript: text, you can close the editor window and Omnis replaces the selected JavaScript: commands with the new content, creating a JavaScript: command line for each line of JavaScript.
The editor window allows you to change the theme of the displayed text, and to revert to the original text.
Spaces & End of Line Characters
There are two new options in the Method Editor View menu to allow you to show Trailing Spaces and End Of Line characters when editing text in the new popup JavaScript or SQL text editor:
Show Significant Trailing Spaces
If true, the editor displays trailing spaces for the JavaScript:, Sta: and Text: commands as the Unicode sp symbol.
Show Selected End of Line As Symbol
If true, the editor displays the end of line character as Unicode symbol cr when the end of line character is selected. This allows you to see if an end of line character will be added to the clipboard by a cut or copy, for example.
Both of the new options default to true and are saved with the window setup.
Trace Log
The Send to trace log command includes the name of the method that issued the command in column -Double clicking on the trace log line takes you to the code line that issued the command.
In addition, the Send to trace log command has the "Always log" option. If specified, the command will always log the message even if $nodebug is true for the library or the local debugger is disabled (this option is ignored for a diagnostic message).
Error Processing
There is a library preference $clib.$prefs.$errorprocessing that allows you to control how Omnis behaves when it encounters an error: Omnis either enters the debugger (if available) or reports the error with an OK message.
- $errorprocessing
A kEP... constant that indicates how unhandled errors in methods belonging to this library are processed. Values of the kEP… constant are:
kEPreport: Report the error by opening the debugger if available or by displaying a message box (the default value after converting a library to Studio 10.x)
kEPlogStackAndReport: Log the call stack to the trace log and then report the error by opening the debugger if available or by displaying a message box
kEPlogStackAndContinue: Log the call stack to the trace log and then continue execution with the next method command
The call stack written to the trace log is drawn using the “bad syntax” color from the appearance settings. Each line contains the error code and error text, and then the call that invoked the error (shown in one line in Studio 10.x). You can double-click on a line to open the method at the relevant method line, provided that the library is not marked as always private and the class is not protected. The call stack excludes entries from methods running in tasks marked as IDE tasks which have their code in an always private library.
Dynamic Methods & Objects
The handling of dynamically added or modified methods, and dynamically added and removed objects has been improved.
The stack list has a new menu item, to detach the debugger from an instance. Previously this was only possible by force-closing the current debug instance.
The debugger tree lazily updates to show new or deleted objects in the current debug instance: typically, this means it updates either when the debugger window comes to the front, or while you are stepping through code.
When an instance closes, or an object is removed, Omnis deletes any breakpoints set in a method in a freed temporary instance field method, and removes all of its methods (if any) from the method editor history stack used by the back and forward navigation buttons.
Omnis marks each temporary method (i.e. instance method), using a new icon so you can recognise these easily in the tree. If you edit such a method, the edits are saved with the instance, and will be lost when the instance destructs.
You cannot rename a temporary instance object shown in the method editor tree.
Code Assistant
The Code Assistant is an integral part of the Code Editor, but it is described separately here since it has so many useful features to help you write better code and faster. The Code Assistant opens automatically at the insertion point when you type a command name, a command parameter, a variable name, or some notation in the Code Editor or you can open it at any appropriate point in your code using Ctrl-Space. The Code Assistant will usually drop down below the insertion point, but may pop up if space below the cursor is limited.
The Code Assistant only opens when the caret is visible in the method editor, i.e. it can only open when no text is selected in a line of code. Specifically, it will pop up when the caret is positioned at the end of some text which is either at the end of the entry field content in the method editor, or prior to some type of delimiter in the expression syntax, e.g. a function separator character. The automatic popup is delayed by a timer which is specified in an Omnis preference called $codeassistanttimer (in Omnis.$prefs).
Further highlights of the Code Assistant include:
In addition to Ctrl-Space, you can use various special keys to navigate the popped list and request further help.
It provides assistance entering notation relative to an item reference and functions.
It displays method descriptions, method definitions and parameter descriptions.
Assistance entering notation relative to a group method, as well as notation relative to $ref in the parameters of a group method.
Intelligent generation of the list of possible values to assign to a property.
Property and method tips in the method list.
Assistance for initial values and when using expand entry-box in the method editor.
An improved expand entry-box interface.
Replaces existing data when selecting an item in the Code Assistant popup.
Assistance entering certain commands such as Do method.
Parameter highlighting, including parameters for commands such as SMTPSend.
Parenthesis and square bracket matching.
Assistance entering methods with overloaded definitions.
When the Code Assistant is opened, items in the help list are listed in the following order:
These are sorted alphabetically within each set. This ordering was introduced in Studio 11, so if you want to use the old sorting you can set the ‘oldSortOrder’ item in the ‘codeAssistant’ section of config.json to true (the default is false).
Shortcut Keys and Help
You can manually request the Code Assistant popup to open by typing Ctrl-Space: this will work on Windows and macOS. The Ctrl-Space shortcut key will only work if some code assistance is available for the syntax item to the left of the current insertion point. This short cut key is a de-facto standard used to request code assistance in many other development tools so should be familiar to developers.
The Code Assistant supports the Page up, Page down, Home and End keys, to navigate the popped up list. When you use these keys, or Up Arrow or Down Arrow, the Code Assistant displays help information about the currently selected line in a help panel above the popped list, for example, the following image shows the help text for $pathname which is a property of the current library ($clib).
Short Cut Key Summary
| Ctrl-Space |
Opens the Code Assistant |
| Page up, Page down |
Displays next or previous ‘page’ in the popup list or Help pane |
| Home and End keys |
Moves to the beginning or end of the popup list |
| Up or Down Arrow |
Moves up or down the popup list |
| Return or Enter |
Select the current line in the popup list |
| Shift-Space |
Initiates a ‘fuzzy’ search at the insertion point |
Fuzzy Search
You can initiate a ‘fuzzy’ search at the insertion point by entering a search string and pressing Shift-Space. The Code Assistant will look for methods, properties, etc, that ‘contain’ your search string, rather than the default ‘starts with’. For example, when searching for the color properties for a Description label in your code:
Do $cinst.$objs.Description.$col
you could type “.$col” then press Shift-Space, and the Code Assistant will popup containing the properties $backcolor and $textcolor. In this case, the Code Assistant will search for properties of a Label containing “col”: without the fuzzy search shortcut key there would be no search results.
Tabbing Behavior
There is an item ‘tabAlsoLeavesFieldAfterClosingAssistant’ in the ‘codeAssistant’ entry in the Omnis congfi.json file that affects the tabbing behaviour in the Code Assistant. It is set to false by default, but if set to true (and ‘oldTabReturnBehaviour’ is false) then a tab will close the Code Assistant and the cursor will move to the next field in the tabbing order when tabbing out of the variable name or calculation box in the method editor.
Code Assistant Configuration
There are a number of settings in the “codeAssistant” section of the Omnis configuration file (congfig.json) that allow you to control the behavior and appearance of the Code Assistant or specifically the parameter help panel.
parameterHelpEnabled
boolean property, default is true. Enables or disables the Code Assistant.
maxParameterHelpWidth
specifies the maximum width of the parameter help popup (it defaults to half the screen width)
parameterHelpExclusions
specifies which functions or methods you wish to exclude from parameter help (the default is empty, that is, no items are excluded). For example, you might want to exclude the function “con” or the notation “$assign”.
width
specifies the width of the Code Assistant window (the default is 768 pixels); the value must be between 512 and 1536 inclusive
openParameterHelpWithCodeAssistantPopup
If true (the default), the code assistant and parameter help window both open on the same side (above or below the text being entered). If false, they open on opposite sides.
parameterHelpSpace
Defaults to 40 (pixels). Space for parameter help on the same side of the text as the code assistant popup; applies when openParameterHelpWithCodeAssistantPopup is true
listShowsNamesFirst
If true (the default), method names occur in the Code Assistant list before attributes etc that start with $. When false, $ entries typically occur before names
What Help does the Code Assistant Provide?
In most cases the Code Assistant will popup automatically at the cursor if it can provide help for the current item in your code or context, however the following sections detail the behavior and function of the assistant with regards to different items or contexts in which Omnis provides you with help.
Item References and Notation
In order to provide code assistance, Omnis needs to be able to look up a notation string and map it to the table of methods and properties that apply to the current addressed item. In order to do this for notation paths that start with an item reference, Omnis needs a new piece of information that identifies the notation you intend to use with the item reference – this item is called the item reference class and the method editor allows you to select an item reference class as the subtype of an item reference. The class works in the same way as the subtype of an object reference, meaning that the item reference class is solely used to provide code assistance – no check is ever made to see if the item reference is being used at runtime to address items that correspond to its class.
Item reference classes use a similar hierarchical scheme to notation paths. Example classes are $iwindows.window, and $iwindows.window.$objs. There are some special classes that include * in their path. For example,
$iwindows.window.$objs.*
accumulates all possible properties and methods for the possible children of $objs (there is a child for each object type), and is used when the Code Assistant cannot isolate the class of the member of $objs to a single object type.
$iwindows.window.$objs.*.$objs accumulates all $add, $addafter and $addbefore methods for all containers, and is used when the Code Assistant cannot determine the type of a container.
Code assistance for notation works as follows:
The Code Assistant takes the notation path (and the item reference class if necessary and available) and looks up the matching item reference class.
If it cannot determine a class, then the Code Assistant provides no assistance.
If the Code Assistant can determine a class, then it pops up the methods and properties that match the currently entered prefix.
Functions
Code assistance is available for functions, including the static methods implemented by external components such as the FileOps external object. The latter is provided by a two-step process, where you first select the component from a popup, such as FileOps.$, and you then select the method from an automatically popped up list of static methods.
The Code Assistant will show a full help page for the function, or a short text description if a help page does not exist for the function. If you do not want the full help pages to display for functions you can set the useOmnisHelpPagesForFunctionHelp entry in the codeAssistant section of config.json to false.
Do command
The Code assistant adds matching commands when entering what could be command parameters, e.g. when entering probable parameters for Do, the Code Assistant will also add Do method, etc, commands to the list.
Note that when typing command names, you can omit spaces and the command will be found more easily, for example, to find Do inherited, you can type doi.
The Code Assistant displays method descriptions and parameter information in the help panel when a method is selected in the popup. This information is available for all types of method, including functions, external component methods, built-in Omnis notation methods, and your own custom methods.
If you highlight the method name using the up and down arrow keys, a full description is shown in the help pane in the Code assistant popup: for example, the following shows the help for the $writefile FileOps method:
Group Methods
Methods such as $add and $findname for a notation group return an item reference to a member of the group (assuming they work). The Code Assistant assumes that the call will work, and provides assistance for notation entered after the group method, e.g. if you enter $cinst.$objs.$add(kEntry,0,0,100,100), then as soon as you enter a dot (.) after this expression, you get assistance for all objects that could be in the group (Omnis does not parse the $add call and attempt to provide help for the specific object type added).
$obj and $field
Code assistance is provided for $cinst.$field to allow code assistance to be provided without making $cinst.$objs harder to enter; $cinst.$field is equivalent to $cinst.$obj, but $field only works for subform and subwindow instances.
The notation $field behaves the same as $obj when used with a subform or subwindow instance, for remote forms and windows only. This allows code assistance to be better targeted, and also prevents $obj from taking over as the first property in the code assistant list after typing “$cinst.$o”.
$ref
When you use group methods such as $sendall or $makelist, you use $ref in the parameters of the group method to refer to a member of the group. The Code Assistant provides help for $ref, by using the relevant item reference class for the group member (provided it can identify the item reference class of the group).
$assign
When you enter . after a property name, the Code Assistant provides $assign and $canassign as possible options. If you select $assign, you will be prompted with a popup that provides either all initial items you can enter, or the list of constants or strings which make sense to assign to the property. The latter always applies when the Code Assistant can determine the list of constants or strings which make sense.
In addition, when you are coding a Calculate statement, if you enter a path to a property in the field name field in the method editor, then when you move to the calculation field, provided that the calculate field is empty, the Code Assistant will pop up the list of constants or strings which make sense to assign to the property.
For example, enter $cwind.$objs.test.$backcolor as the field name, and move to the empty calculation field. The popup will contain a list of color constants.
If you wish to assign something else, start typing that, and assistance will revert to normal. The only restriction here is that if you type k (when the values that make sense are a list of constants), you will only see the constants that make sense, rather than all constants.
The method editor displays a tooltip when you position the pointer over a property of a method name in the listing of the method. This shows you the property description, or the method interface and description. The tooltip for a constant also shows you the constant description.
Initial Values
You can use the Code Assistant in the initial value column of the variable pane of the method editor.
Expanded Entry
The Code Assistant is available in the expanded entry box in the method editor – it opens as an overlay over the method editor command palette. You can close it by clicking on another window, pressing return (or pressing escape to discard changes).
Replacing Data
When you select some notation from the Code Assistant popup, it replaces the entire word (if any) in which the caret is located.
Method Commands
The commands Do method, Do async method, Do code method, Load error handler, Unload error handler, Set ‘About’ method, Set timer method, Start server, Install menu, Install toolbar, Open window, and Set report name use a Code Assistant popup to select their method or class.
Parameter Highlighting
When you position the caret somewhere in the parameters of a function or method that the Code Assistant recognizes, or in a method command that has parenthesized parameters e.g. SMTPSend, Omnis displays a popup (in the opposite direction to the Code Assistant popup) that displays the method parameters and the method description. In addition, the parameter in which the caret is currently located is highlighted in bold.
You can press Escape to temporarily dismiss this popup (unless “parameterHelpEnabled” in config.json is set to false).
Parenthesis Matching
When you position the caret immediately after an open or close parenthesis in an expression, or immediately after an open or close square bracket, Omnis draws the matching parentheses or brackets using a different color.
There are two properties which control this, in the method editor chroma coding options: $bracketbackcolor and $brackettextcolor. To disable this, you can set both of these options to kColorDefault.
Overloads
Certain methods are overloaded. In simple cases, the Code Assistant shows this by using a vertical bar to separate different possibilities e.g.
$remove(rLine|iLineNumber|kListDeleteSelected|kListKeepSelected)
However, there are other cases where this is not possible, for example:
$createobject for a JavaObjs\System\java\lang\String object has 15 overloads
$add for an unknown window object could be adding a complex grid or paged pane or scroll box, and the object being added may or may not be an external component.
In these cases the description shown for the method shows all overloads, and the parameter highlighting popup has arrow icons, indicating that you can use the up and down arrow keys to select the overload you are using, thereby resulting in sensible parameter highlighting. Omnis does not attempt to figure out the matching overload by analysing the parameters.
Custom Properties
The Code Assistant recognises custom properties, i.e. properties of an instance or an instance object, implemented using two methods, $propname and $propname.$assign. The Code Assistant combines these into a single property in the list of completions rather than showing the two methods, and provided that the Code Assistant can resolve the parent notation, it will also show $assign and $canassign as possible completions for notation relative to a custom property.
Omnis Help
While using the new Code Editor you can open the inline Omnis Help system by pressing F1 or using the Omnis Help Topics option in the main Help menu. The Omnis Help provides comprehensive help for all commands, functions, notation, and so on: the content in the Omnis Help is the same as that provided in the Code Assistant.
What is displayed in the Omnis Help is context sensitive and will depend on what is currently selected in the Code Editor, as follows:
If no text is selected in the Code Editor, it tries to obtain the text from the syntax item containing the caret - if there is nothing useful, no help will be displayed, otherwise it will pass the text for the syntax item to the help system, e.g. ‘Calculate’ for a Calculate command when the caret is in the command name.
If some text is selected, and all selected text is on a single line, the editor passes the selected text to the Help system. If the selected text spans lines, no help will be displayed.
After performing 1 or 2, the Help system opens. If the text passed to the Help system uniquely identifies a single help page, that help page is displayed. Otherwise, the help window opens at the search tab, searching for the text passed to the Help system.
Debugging Methods
You can open most class and field methods and run them from the debugger menu bar or toolbar. Note that event handling methods will not run from the On command without the event, but you can try out most types of methods while you are in design mode. You cannot execute methods that contain instance or task variables at design time since these variables are only available when the objects are instantiated.
To run or execute a method
- Select Debug>>Go from the debugger menu bar
or
- Click on the Go button on the debugger toolbar
Execution will begin from the selected line. When you first open the method editor the first line of the first method is selected. You can halt execution by pressing the stop key combination Ctrl-Break/Cmnd-period/Ctrl-C. When you break into a method the debugger completes the current command and halts execution.
Along with the Execute and Test options, the basic debugging operations on the Debug menu are:
Go (F5) executes from the Go point
Step (Ctrl+Shift+S) executes from the Go point to the next method line, stepping into recipient methods
Step Over (Ctrl+Shift+V) runs from the Go point to the next method line, executing method calls, but not stepping into them
Trace (Ctrl+Shift+E) steps automatically through the method
Set Go Point (Shift+F2) sets the current method line as the Go point
Go Point Not Set indicates the method with the Go point when one is set
From Line and To Line runs, steps or traces from the current line or to the current line
You can Alt-click in the left margin of the Code Editor to execute the "To line" command provided that code is executing.
The Go Point
A method normally runs from the start, but you can start execution from any method line by setting it as the Go Point.
To set the Go point
- Select the method line and choose the Debug>> Go menu option
or
- Select the method line and click the Set Go Point button on the toolbar
The debugger highlights this line and puts a yellow arrow in the left margin pointing to the method line where execution will begin. You can move around the program, changing the code, without changing the go point, which is independent of the current line. The name of the method containing the Go point is shown in the Debug menu and choosing this option from anywhere returns you to the Go point. You can clear the Go point using Stack>>Clear Method Stack.
Execution Errors
When an error occurs in a running method, Omnis takes you into the debugger. The offending method is displayed with the go point at the method line that encountered the error, and an error message is shown in the status area. Error messages include the error number and text, for example “E108139: Set main file command with no valid file name.” You can use the various inspection tools to find out why the error occurred, fix it, and continue.
You can use the Debug>>From Line submenu to run the method from the currently selected line rather than the go point. The submenu items let you Go, Step, Step Over, or Trace from the current line instead of from the go point. The To Line submenu lets you Go or Trace from the go point to the current line, which becomes a one-time breakpoint.
Stepping through a Method
Normally when debugging you will want to step through the code rather than just run it. This gives much more control over when to start and stop methods and lets you examine fields, variables, and the method stack at specific points in the program. You use stepping in conjunction with breakpoints to control the debugging of your code.
To step through a method
- Choose Debug>>Step from the debugger menubar, or click on the Step In button
Every time you click on the Step In button, Omnis executes the line at the go point and sets the go point to the next line. If a command at go point calls another method, the debugger loads the recipient method on the method stack and sets the go point to the first line in that method.
The Step In option steps into a recipient method. You can avoid this with Step Over where the debugger executes the recipient method without stepping into it. This speeds up debugging if you have a lot of method calls.
Tracing a Method
As well as stepping through your code, you can record or trace method execution.
To trace a method
- Choose Debug>>Trace from the debugger menubar, or click on the Trace button
The debugger steps through your code automatically, including stepping into recipient methods, and adds each method line and its parameters to a trace log. You can open the Trace Log from the Tools menu, or by clicking on the Trace Log node in the Studio Browser.
The first column in the trace log shows the name of the currently executing method, and the class it belongs to. The second column shows the method line and parameters of the currently executing command. When you double-click on a line in the trace log, the debugger goes to and highlights that method line.
You can open the trace log from within a method using the Open trace log command. For example, you can place the Open trace log command in the startup task of your library to trace method execution immediately after your library opens.
You can specify the maximum number of lines in the log in the Max lines entry field (this is not available in the Studio Browser view of the trace log); the maximum is 100000. When the log contains the specified max limit, it discards the earliest lines when new ones are added.
Copying code from the Trace Log
You can copy selected lines from the Trace log to the clipboard using the Edit menu Copy command or Ctrl/Cmnd-C shortcut key.
Showing the trace log in the Studio Browser
There is a node in the Studio browser which opens an alternative view of the Trace Log; the current number of lines in the log is shown. There is an option in the HUB options to select whether or not the Trace Log node is displayed in the Studio Browser: the default is on. You can use the search box at the top of the Studio Browser to search the contents of the trace log.
Contents of the trace log
The sys(193) function returns the contents of the trace log. It works in both the development and runtime version of Omnis.
Server socket bind failures
The "runtimeOpensTraceLogOnSocketBindError" option in the ‘server’ section of config.json controls whether or not the Trace Log opens in the runtime when a server socket bind fails: the default value is true, so set this to false to suppress the trace log. In the developer version, the Trace Log window never opens when this occurs as you can view the trace log in the browser.
Private Methods
When you step or trace through the methods in your library the debugger will normally enter each method that is called, even if a method is in a private library. However if you set the library property $nodebug to true, the debugger will not display methods contained in private libraries. You need to set this property each time you open the library.
Method History
Omnis stores a list of visited methods which allows you to quickly move back to a recently visited method. The toolbar in the Method Editor contains a Back and Forward button allowing you to traverse the history of visited methods. Note that inherited methods and the object nodes in the method editor do not form part of the history which can hold up to 256 items. You can also use F10/Shift-F10 to move back and forward respectively. In addition, a long press on either of the buttons opens a menu which shows the available history items in the direction of the button, up to a limit of 20 menu items.
Omnis removes affected entries from the history when a library is closed, a class or method is deleted, or when various other actions occur that would affect an entry in the history list, such as when fields are renumbered.
Inspecting Variable Values
You can inspect the value of a variable or field using the Variable menu (or Variable context menu). You can display the Variable menu for any variable or field by Right-clicking on its name in the method editor or the Catalog.
The Variable context menu gives you full information about the variable or field (or the class it belongs to, if any).
To display the Variable Menu
- Right-click on the variable or field
You cannot inspect the value of instance or task variables in design mode (in a class editor) since the variables do not exist: in this case, the Variable context menu is grayed out. To examine an instance variable in a remote form, set a breakpoint in the $construct method (or somewhere else in your code), then test the form, and switch back to Omnis when the form opens in your browser – at this point you can right-click on an instance variable to examine its values etc.
The Variable context menu contains the variable name, its value, parent group and data type, and a series of debugging options you can apply to the variable; you can also Copy the value for a simple variable or Export a list or row variable from this menu, as well as Insert New and Delete Variable. The other options at the bottom of the context menu are discussed under Breakpoints.
Variable Value window
The first option Variable opens the Variable Value window, except that for Item References with a value, it opens the Notation Inspector.
This window shows the variable name and type at the bottom and displays the value, which you can edit. Omnis updates the value in the window whenever you bring the window containing the method to the top, but you cannot observe the value change dynamically through this window. Note you cannot edit a binary variable.
On the Variable Value window’s View menu
The value window for a variable is valid only for as long as the variable is current.
You can rename a variable in your code directly (rather than having to go to the Variable pane) using the Variable context menu; the option applies to class, instance, local and parameter variables.
List Variables
You can show and edit a List variable in a value window using the Variable context menu option. There is a Search panel in the List variable window to allow you to search the contents of a large list variable while debugging. To search a list variable, click into the List variable window, press Return, and then press the Search button, or select a previously saved search in the droplist. There is also a button to navigate to the current line, which sounds the bell if pressed when there is no current line.
Search results appear in a separate panel that allows you to quickly navigate to results. The Line number and Column name for each search result is shown. If the Column name is empty, the Column number is shown.
Exporting List or Row Variables
The "Export Tab Separated..." option in the Variable menu (in the same location as the "Copy Value" option that appears for various simple data types) allows you to export the values from a List or Row variable. When selected, it prompts for the path name of a file that receives a tab-separated value representation of the list or row.
The output file is UTF-8 with a UTF-8 byte-order-marker. The first export row comprises tab-separated column names. Simple types in the list are exported as their actual value, whereas types such as lists are output as an information string, e.g. (5 Lines). If the characters tab, carriage return, linefeed or backslash occur in the data, they are exported as escapes: \t, \r, \n and \\ respectively. If a column has a #NULL value, it is exported as the text NULL.
Jump to Variable Definition
You can jump to a variable definition in the Variables pane in the method editor using the Variable context menu; this is useful if a method contains many variables and saves you visually scanning the variable list to find the variable.
To show the definition for a variable, Right-click on the variable name in your code and select the Variable Definition option. The focus will jump to the appropriate tab in the Variables panel, highlighting the variable. Alternatively, you can select the <Variable-Type> variables option to pop up a separate Variables panel highlighting the variable.
Variable and Event Tips
You can hover the pointer over a variable name anywhere in the Code Editor to display a Variable tip, showing the variable name and its value, if available.
Precedence is given to variables over functions when generating variable tips in the Code Editor, for example, when a variable name is the same as a function name (although this is generally not recommended).
You can also hover the pointer over an event name, e.g. evOpenContextMenu, to display its definition including all its parameters and their descriptions.
Variable Panel
The Variable panel allows you to view and modify variables while debugging or stepping through your code. It is only populated when execution pauses, as with a breakpoint. After you resume execution, it remains populated (but disabled) for a short time, until either execution pauses again (meaning it updates) or execution does not pause soon enough (meaning it clears). This means that the Variable panel does not flicker while stepping through code.
When execution pauses, the focus moves to the Variable panel. For example, while stepping through code the Variable panel will show $cinst, the task and instance variable values, and the values of any watched variables: see the Variable panel highlighted in red below.
Viewing Variable Data
The Variable panel displays a hierarchy of controls that allow you to drill down into the data. Each time the debugger pauses execution, it refreshes each level of the hierarchy until it reaches a level which is no longer valid, e.g. you might drill down into a local list variable, and execution pauses in a different method, so the local list is no longer valid, so in this case the panel will display the local variables of the new method.
In many cases, the panel displays variables in a grid using either the row or list representation of the grid as appropriate. The grid display for a variable or list cell shows a text representation of the value. This may be either its value, or it may be some other representation, e.g. the number of lines in a list, or an object instance name. The grid is read-only, allowing you to use the arrow keys or tab/shift-tab to move around the grid.
As you move around the grid, the current cell is highlighted, and the data type of the current cell is displayed in the status bar below the grid.
Sometimes a cell represents data such as a list or an object – in this case, you can drill down to view the contents of the cell by either clicking on the cell, or by pressing the Return key. After drilling down, a back button appears in the area above the grid, that you can use to navigate to the previous level, or alternatively you can press Backspace.
You can Ctrl/Cmd+click on a cell that would normally drill down, in order to give that cell the focus.
Buttons to the right of the grid enable, disable or check depending on what you can do with the current cell.
When enabled, you can click on the Modify button, or press the Return key, to edit the variable value. While in edit mode, the remainder of the window disables, apart from Cancel and Save buttons. You can use the Escape key to cancel, and the Return key to save the value (i.e. the key specified as saveModifiedVariable in keys.json): note that the Return key does not allow you to save the variable if it makes sense to add returns to the data being edited.
There is also a button to toggle the current value between NULL and empty.
Top Level Variable panel
When you first pause execution, the debug window displays the top-level Variable panel. This allows you to view Auto, Task, Class, Instance, Local, Parameter, Event Parameter, File and Hash variables. Auto comprises variables identified from the line before the current line (if any), the current line, and up to 2 lines after the current line.
The top of the top-level Variable panel allows you to select the currently displayed scope:
You can either click on a button (heading) or type its first letter when the Variable panel has the focus, to display the scope. Save Window Setup will save the current scope.
With the exception of the File scope, each scope displays its variables in a grid. The file scope initially displays a list of file classes. You can then drill down into a file class, in order to view its values.
For task, class and instance variables, the panel shows the values for all levels of the inheritance hierarchy, with the names of inherited variables shown in the inherited color.
Table Instances
There is an entry "Table instance data" at the start of the Auto tab when debugging code in a table instance. Simple references like $cinst.name will show in the Auto tab, when name is not a variable in the normal variable scopes, e.g. a column in a row in a table instance.
Object Variable panel
When you drill down into an object or object reference, the panel displays properties and/or variables. The top of the panel looks like the following:
In the case of a non-visual object, all the buttons at the right are hidden, and the panel just shows properties. In the case of a sub-classed non-visual object, all buttons are present and enabled. In the case of an object that is not sub-classed from a non-visual object, the properties button is disabled.
As for the top-level panel, you can either click on a button, or type its first letter when the Variable panel has the focus, to display the scope.
List or Row Variable panel
For a row, this is a straightforward grid. When you drill down into a list, the panel initially displays the first 64 lines (or $linecount if less than 64) of the list. Next and Previous buttons at the top-right of the panel allow you to read more lines:
If you hold the Shift key while pressing the button, the panel reads all data in the direction specified, in chunks until there is no more. While doing this, it may display a working message (if it takes long enough), which you can use to stop any further data being read.
Each time you step, and the variable remains in scope, the panel initially updates with the chunk of data from the start of the current scroll position.
You can modify the current line and selection of the list using the buttons on the Variable panel. These prompt for the new current line, or changes you want to make to the selection.
Item Reference Panel
When you drill down into an item reference that has properties (rather than an item which is a reference to a variable), the panel displays the property values of the item. You can use this panel to modify values for which $canassign is kTrue, provided that they are of a suitable data type for editing.
Integer
Integer variable values are displayed directly in the table. You can click on the H icon to display integers in Hex format. In either display mode (decimal or hex), when modifying an integer, you can either enter a decimal value or a hex value.
Large Character
Character variables containing more than 128 characters are displayed as their length followed by a preview of the start of the data. You can drill down into the variable, displaying a character Variable panel. When you first drill down, this displays up to the first 64k characters. Next and Previous buttons at the top-right of the panel allow to to read more chunks:
If you hold the Shift key while pressing the button, the panel reads all data in the direction specified, in chunks until there is no more. While doing this, it may display a working message (if it takes long enough), which you can use to stop any further data being read.
Each time you step, and the variable remains in scope, the panel initially updates with the chunk of data from the start of the current scroll position.
If you edit the data, the edit applies to the entire variable value, i.e. the new value comprises any data on the server before the loaded data, followed by the edited loaded data, followed by any data on the server after the loaded data.
Binary
To view and edit a binary variable, you always need to drill down. You are then presented with a hex binary editor grid. When you modify the variable, a button on the right provides various binary editing operations. The binary panel works in a similar way to the character panel, with next and previous buttons.
Picture
You can drill down into a picture variable and view, edit, or save it using the Save picture button (folder icon). The new button is available when viewing image data, in the modify tool strip to the right of the image.
The Save picture button is enabled when not modifying the variable value, and when the debugger recognizes a JPEG, GIF or PNG (the latter includes shared pictures stored as PNG, in which case the saved image is a PNG without the shared picture header). The button uses the binaryEditOperations keyboard shortcut.
Boolean
Boolean variable values can be Empty, False or True. These can be set using the variable grid drop list.
Omnis does not treat Empty and False as two different values of Boolean variables, when displaying them in the debugger. Therefore, the debugger Variable panel, variable tooltips, variable context menu and variable window all display and treat Empty as False or NO as appropriate.
The Values List
In addition to the Value window for an individual variable you can show a Values List for whole groups of variables such as task variables, class variables, and local variables.
To show the Values List for class variables
The Values List for class variables appears with the different variable types on tabbed panes.
On the View menu for the window
The Variable popup menu for a file or schema class lets you modify the class, and for file classes only the Values List shows the current values for the file class.
Sorting Variables
There is a Sort Names command on the View menu of the variables list window available in the Method Editor when inspecting variables. The sort order is always set to an ascending sort, and is not case sensitive. This item is toggled on or off when selected (the state is saved with the window setup).
Displaying Control Characters
You can display control characters in data or content when inspecting a variable in the Field Value window and Values list window, displayed when you Right-click on a variable: these tools have a menu that allows you to:
Show characters normally
Show all control characters (in this case no line breaking occurs on carriage return for multiline entry fields)
Show all control characters except carriage return (in this case carriage returns break lines as usual)
The menu also allows you to increase and decrease the font size used for all content except the binary data.
The control characters are displayed using the Unicode page 0x2400 which has visual representations of control characters. In addition to characters 0-0x1f, 0x7f (del) is also treated as a control character.
In addition, the Catalog status bar, Variable value tooltips and Variable context menus always show control characters if present.
The Save Window Setup option for the Values list saves grid column widths, and the height of the value when using show full value. Save Window Setup for both the Field value window and the Values list window saves the current font size and the option controlling how or if control characters are visible.
Watching Variable Values
You can monitor or watch the value of a variable by making it a Watched variable. You can add task, class, local, instance and parameter variables to the Watch variables pane in the method editor. When you run the debugger you can see the value of a watched variable change in the Watch tab in the Variable panel (bottom right of the Code Editor).
To set a watch variable
- Right-click on the variable name and choose Watch Variable
or
- In the method editor, drag the variable from the variable pane into the watch pane
The Watch Variable item on the context menu is now checked. You can enlarge the watch pane by dragging its borders. The watch variable value is only updated when stepping, unless the method redraws it.
To remove a watch variable
- Right-click on the variable name and uncheck Watch Variable on the popup menu
Breakpoints
A breakpoint is a marker on a method line. When the debugger reaches that line, it stops execution and makes that line the go point. When a breakpoint is encountered and you have switched to a different application (such as a browser in the case of debugging JavaScript Client methods) the Omnis entry in the Windows Task bar will flash and you have to click the button to return to Omnis to continue debugging.
To set a breakpoint
- Click in the margin of the method line
or
- Click in the method line and click on the Breakpoint button
When you set a breakpoint for a line, a red dot appears in the left margin. A one-time breakpoint is a breakpoint that the debugger removes immediately after you break on it. It is marked by a blue dot in the margin.
When you close a library, you lose all breakpoints in the methods in that library. You can use the Breakpoint command in a method to set permanent breakpoints, but you must be careful using permanent breakpoints since you may forget to remove them and they may be encountered in your application when it is deployed to end users!
The Breakpoint menu lets you create and clear breakpoints.
Breakpoint (Ctrl/Cmnd-Shift-B)
sets a full breakpoint at the current line
One-time Breakpoint (Ctrl/Cmnd-Shift-O)
sets a one-time breakpoint at the current line
Clear Breakpoints (Ctrl/Cmnd-Shift-C)
clears all the breakpoints
Clear Field Breakpoints (Ctrl/Cmnd-Shift-F)
clears all the field change breakpoints, calculation breakpoints, and min and max settings (see below)
The rest of the Breakpoint menu is a list of all the current breakpoints. Choosing a breakpoint from this menu displays the line in the debugger.
You can also set breakpoints and from line to line execution, by right-clicking in the left margin of the method line or by using the appropriate tools on the toolbar.
Breaking on Variable Change
In the second half of the variable context menu, there is a group of breakpoint options that let you set breakpoints based on variable or field values.
The debugger only tests for variable or field breakpoints when methods are running, so a variable change during an enter data suspension of a method will be immediately reported if there is a control method and delayed otherwise. If there are several variable breaks at the same command, the debugger only displays one. Setting a variable value breakpoint slows down method execution considerably.
The menu option Break on Variable Change tells the debugger to stop the method when the variable value changes. The debugger puts a check mark against the line. Reselecting the same line toggles the break off. The status line displays the text ‘Break on variable change (field)’ when the break occurs.
The One-Time Breakpoint option puts a single-stop variable change breakpoint on the line.
Breaking on Calculation
You can also create a variable value breakpoint with a calculation. For example, to stop a method when a local variable lvLines becomes equal to the number of lines in list cvList, the calculation is entered as
lvLines = lst(cvList,cvList.$linecount)
The menu option Break On Calculation sets the breakpoint, and the following line Set Calculation prompts for the calculation. The debugger treats the calculation value as a boolean value where zero corresponds to No and anything else corresponds to Yes. Execution breaks when the calculation evaluates to Yes, but with a qualification: the break happens only when the calculation changes from No to Yes. This means that if the calculation is always Yes, the break never happens: it also means that the break happens only when the change is from No to Yes, not every time the calculation evaluates to Yes.
For example, the calculation break
(lvNumber<10) | (lvNumber>20)
ensures that local variable lvNumber stays within the range 10-20.
Each variable or field can have one calculation breakpoint. There is no requirement that the calculation refers to the variable.
The Store Min And Max option adds the minimum and maximum variable values to the end of the menu as execution proceeds, along with the item Clear Min and Max that lets you turn off the feature. If you choose either menu item, Omnis writes a line to the trace log. Turning on Store Min And Max slows down the debugger a good deal.
The Method Stack
A stack is a list of things that you can access in a last-in, first-out manner. When you call a method, Omnis pushes the current method onto the method stack of executing methods. The debugger adds each new method to the Stack menu in the method editor. The top-most menu item is the latest method, the one below it called it, and so on. When a method returns, Omnis removes the top item, also known as popping the stack, and goes to the calling method. You can examine any method on the stack by selecting it. You can also move up and down the stack with the Stack menu items Move Up Stack and Move Down Stack.
If you select a method in a different class while holding down the Shift key, the debugger opens a new method design window.
When you stop in a method with a breakpoint, an error, a step, or an explicit stop, Omnis sets the go point to the next method line and saves the stack. It marks the commands in the methods on the stack that will execute when you return to that method with a gray arrow in the left margin pointing to the method line where execution will resume.
A method can appear more than once in the method stack with a completely different set of local variables.
Debug>>To Return runs or traces the method from the go point or current line until it returns control to the method that called it. If the only method on the stack is the current method, this option is grayed out.
There are times when you may want to throw away the current stack and start over. For example, if you follow a problem to its conclusion and everything freezes up, you can restart by clearing the stack. You do this with Stack>>Clear Method Stack, which also grays out the To Return item and removes the Go point.
Method stack list
The sys(192) function returns a list representing the current method call stack, with a line for each line in the debugger stack menu. The first line in the list corresponds to the call to sys(192), and subsequent lines correspond to how the method running the previous line was called.
The list has 6 columns:
| classitem |
Item reference to the class containing the method. |
| object |
The name of the object containing the method in the class: empty if it is a class method. |
| method |
The name of the method. |
| line |
The line number in the method, of the method line resulting in the method on the previous line running. |
| linetext |
The text for the method line. |
| params |
The parameters passed to the method. This is a two column list, with the column name and value (the value displayed as a tooltip for the parameter). |
The sys(192) function works in both the development and runtime version of Omnis.
The sys(290) function returns the number of methods on the Omnis method stack.
Method stack limit
You can control the number of methods on the Omnis method stack by setting the stackLimit item in the "default" section of the Omnis configuration file (config.json); the default value is 30 which is adequate for most applications. Omnis fetches the value of stackLimit on startup, therefore when a library is opened, the stack limit is already in effect.
Debugger Options
The debugger Options menu appears with the other debugger menus.
Debug Next Event
stops at the first line of a method executed for an enter-data event with a control method (a field method, a window control method or a timer method). Note this option is not saved with other debugger options and defaults to off whenever Omnis is started
Trace All Methods
sets trace mode permanently on.
Open Trace Log
opens the trace log window or brings it to the top
Disable Debugger at Errors
stops Omnis from breaking into the debugger on program errors: this is what the end user of your application would see
Disable Debugger Method Commands
deactivates any debugger commands in the methods
Save Debugger Options saves all the debugger options, and Revert To Saved Options reverts back to the last saved set of debugger options
Debugger Commands
You can control the debugger using the Debugger... commands: see the Code Assistant or the Omnis Help for a complete description of these commands. Note that none of the Debugger commands will work in client-executed methods in the JavaScript Client, however, while developing your app, you can use the Send to trace log command in a client method to write a line to the JavaScript console.
The Breakpoint command breaks the program when Omnis executes it. If you specify a message, it appears on the status line when the break happens.
Using the Trace Log
The Trace on command switches trace mode on, optionally clearing the trace log, and Trace off switches trace mode off.
Send to trace log adds a new line to the trace log containing the specified text. The text can contain variable names enclosed in square brackets. You can then use the log as a notepad for your comments, variable or field values, and bookmarks in the code. If you enable the Diagnostic message option in the Send to trace log command Omnis will send the message to the trace log substituting any variable values where appropriate. To enable diagnostic messages in the trace log, you must right-click on the trace log and select the Log Diagnostic Messages option.
You can double-click on lines in the trace log to open the method editor at the appropriate point in the method.
You can increase and decrease the size of the font in the Trace log using the Ctrl+ and Ctrl- options. The Save Window Setup option saves the current font size. (Note the font size of the trace log panel in the browser is not saved.)
Styled Text
The Trace log allows text styles to be added to the logged text. The Send to trace log command supports text styles, added using the style() function inside square brackets, such as kEscColor and kEscStyle. For example, you could apply colors to sections of the logged text when it is displayed in the trace log panel in the browser or the trace log window; such styles are stripped when writing the trace log line to the text log file in the logs folder.
The trace log renders the text styles if the entry traceLogUsesStyles in the ‘defaults’ section of config.json is set to true (this replaces the ide entry traceLogUsesSyntaxColors in versions before Studio 11).
Note that if you use styles other than kEscColor and kEscStyle, these styles are ignored when copying selected trace log lines to the clipboard as HTML.
For JavaScript client-executed methods, where the Send to trace log command sends the text to the JavaScript console (provided it is available), text styles are not supported.
Debugging Variables
The Variable menu command applies a variable context menu option to a list of variables. The list has the same format as Define list, and for fields can include file names and so on. This command has several options.
Set break on field change
sets a field change breakpoint for each field in the list
Clear break on field change
clears any field change breakpoints for each field in the list or all breakpoints if you don’t specify a field list
Set break on calculation
sets a calculated breakpoint for each field in the list: set the calculation for each field with Set break calculation
Clear break on calculation
clears any calculated breakpoints for each field in the list or all calculated breakpoints if you don’t specify a list
Store min and max
stores minimum and maximum values for each field in the list
Do not store min and max
clears store min and max mode for each field on the list or all modes set if you don’t specify a list
Add to watch variables list
adds each specified field to the watch variables pane
Remove from watch variables list
removes each specified variable from the watch variables pane or all variables if you don’t specify a list. Variables with breakpoints or with store min and max mode set always appear on the watch variables list
Send value to trace log adds a line to the trace log for each field on the list: if you don’t specify a list, adds a line for all fields
Send minimum to trace log adds a line to the trace log with the minimum for each field on the list for which the debugger is storing minimums: if you don’t specify a list, adds a line for all such fields
Send maximum to trace log adds a line to the trace log with the maximum for each field on the list for which the debugger is storing maximums: if you don’t specify a list, it adds a line for all such fields
Send all to trace log adds a value line to the trace log for each field on the list; also adds minimum and maximum lines to the trace log for each field on the list for which Store min and max is set: with no list, adds a line for all appropriate fields
Open value window opens a value window for each field on the list: with no list, opens a window for all fields with whatever limit the operating system puts on the number of window instances
Open values list opens a values list containing the value for each field on the list: with no list, opens a values list for all fields, subject to the operating system limit on the number of window instances. There is one values list for each file class so if more than one field name from a particular file class appears in the list, Omnis displays only one values list for that file class
Set break calculation sets up the calculation for the field breakpoint
Checking Methods
You can check the methods in your library using the Method Checker. The method checker is available under the Tools>>Add-ons menu on the main Omnis menu bar. It checks your code for syntax errors, unused variables, methods without code, and so on. It provides various levels of checking and reports errors in individual classes or all classes in the current library. Specifically, it is useful for checking libraries converted from an earlier version of Omnis.
Note that the method checker does not correct the code in your libraries automatically, it simply reports any errors and potential problems in your code.
When you open the method checker it loads all libraries that are currently open. Alternatively, you can open a particular library from within the method checker.
To check the methods in your library
Select the Tools>>Add-ons>>Method Checker menu item from the main Omnis menu bar
If you need to load a library, click on the Open Library button on the method checker menu bar
Double-click on the library you want to check
Shift-click or Ctrl/Cmnd-click to select the classes you want to check, or click on the Select all classes button to select them all
The following checking levels are available
Error conditions
this level of checking finds problems that can cause runtime errors or undesired behavior: you must fix these errors
Include Level 1 warnings
finds problems that you should investigate because they might result in subtle bugs and strange behavior: you ought to fix these problems
Include Level 2 warnings
finds problems that you should be aware of, including empty methods and/or inefficient code, potential compatibility problems, and platform-dependent code
The different levels of checking are inclusive, that is, if you select Level 2 Warnings (the default) this includes Level 1 and the Errors categories.
- Select a checking level, and click on the Check button
The method checker works through the classes you selected displaying their statistics in the Method Checker Error Log. You can cancel checking at any time by pressing Ctrl-Break/Cmnd-period/Ctrl-C.
When checking is complete, you can sort the log by clicking on one of the headers in the list. You can print the log or save it to a text file.
You can show a summary of the errors for each class by clicking on the Show Summary button.
Interpreting Errors and Warnings
The following sections detail the different levels of errors and the possible action you should take.
Fatal Errors
These are the type of errors that you must fix.
Encountered a construct End without a construct Begin
An ending construct was found without a matching beginning:
- End if, End switch, End while, End for, Until, End reversible block
Method contains a construct Begin without a construct End
A beginning construct was encountered without the proper ending:
- If, Switch, While, For, Repeat, Begin reversible block
Construct End does not match construct Begin
An ending construct was encountered that did not match the beginning construct, e.g. Begin reversible block followed by an End if.
Encountered a construct element in an invalid context
One of the following was found outside of a proper construct: Else, Case, Default
Encountered a command in an invalid context
One of the following commands was found outside of a proper construct: Break to end of switch outside of a Switch construct, or Break to end of loop or Jump to start of loop outside of a For, While, or Repeat loop.
Incomplete command
A command with no parameters set, for example, Set reference with no reference, Set current list with no list name, Call method with no method name.
Invalid field reference
An invalid reference to a field or variable (i.e. #???) was encountered: usually a reference to a field or variable that has been deleted.
Invalid method reference
Encountered a command containing a reference to a non-existent method, an unnamed method, or a method in a library that is not currently open. For example, Call method with name of non-existent method, Enable menu line with reference to non-existent menu or menu line.
Missing extended command or function
A missing extended command or function was encountered, either not loaded or installed: these show in your code beginning with the letter “X”.
Bad library name
The library name contains one or more periods.
OK Message or Sound bell
Either OK message or Sound bell command in a server executed method or remote task method; these should be removed or commented out.
These are the type of problems that you ought to fix.
Class variable with the same name as a library variable
Could cause precedence problems at the class level.
Optimize method command not in first line of method
The Optimize method command should be the first line of a method.
Code in an unnamed method
Named method with no code
Check to see if this code/method is required.
Debugging code?
You should remove all breakpoints before deploying your application. One of the following was encountered: Breakpoint, Trace on/off, Field menu command, Set break calculation, Send to trace log.
Obsolete command
You should not use obsolete commands: remove them from your code. For example you can replace Call method with Do method or Do code method.
Command removed by converter
In converted libraries certain commands are commented out: you should use another command or use the equivalent notation.
Level 2 warnings
These are the type of problems that you should investigate that might require fixing.
Unused variable
Variable defined but unused, or referenced and not defined.
Unfriendly code: Code which could affect other libraries if running in a multi-library environment
For example, Clear method stack, Quit all methods, Close all windows, Remove all menus.
Unfriendly code: Code which would cause the current library to be closed
The following commands will close the current library if the “Do not close other libraries” is not set: Open library, Create library, Prompt for library.
Class name specified in an internal method call
Inefficient code.
Code that modifies a library or class
One of the Classes... group of commands, such as New class, Rename class, Delete class.
Platform-dependent code
Functions which return different values depending on which platform they are executed, including sys(6), sys(10) to sys(22), sys(103) to sys(114).
Comment containing a question mark
Usually indicates code that needs to be tested, completed, or fixed.
Reference to hash variable
Avoid using hash variables: replace with variable of appropriate scope.
Omnis Studio allows you to collect data about the performance of method execution in your application.
The Omnis root preference $collectperformancedata enables method performance data collection. Its property is a kCPD... constant specifying whether or not and how Omnis will collect data about method execution performance. The data collected is stored with each method in its class, and can be accessed using the notation. Data is not collected for remote form client methods. The kCPD... constants are:
kCPDnone
Omnis does not collect method execution performance data
kCPDallMethods
Omnis collects method execution performance data for all methods
kCPDmarkedClasses
Omnis collects method execution performance data for methods in classes where the class property $collectperformancedata is kTrue: see below
Classes that can contain methods also have a new property called $collectperformancedata. This property is applied only when $root.$prefs.$collectperformancedata has the value kCPDmarkedClasses. If true, method execution performance data is collected for all methods in the class.
Assuming $root.$prefs.$collectperformancedata allows, the collected data is stored with each method in the class, with the following properties for each method:
$callcount
The total number of calls to the method. You can only assign zero to $callcount, in which case Omnis also sets $totalexecutiontime, $minexecutiontime and $maxexecutiontime to zero
$minexecutiontime
The execution time in milliseconds of the shortest call to the method
$maxexecutiontime
The execution time in milliseconds of the longest call to the method
$totalexecutiontime
The total execution time in milliseconds of all calls to the method
$minexecutiontime, $maxexecutiontime and $totalexecutiontime are floating point numbers.
Data collection does not update the $...executiontime properties when the method is being called recursively, however it does update $callcount for recursive calls.
Classes that contain methods, and can therefore collect method performance data, have two new methods:
There is a very small overhead when data is collected, while there is no impact on performance when performance data is not being collected.
Sequence Logging
Sequence logging allows you to record all method execution in the Development version of Omnis or on the Omnis Server which is used for deploying Omnis web and mobile applications. If your Omnis Server is running multi-threaded mode, sequence logging can log method execution on multiple server threads.
Sys(3000) turns on sequence logging, and sys(3001) turns it off. Sequence logging writes every method command executed to a file in the Omnis directory. The name of the file is reported by an OK message when logging starts. Logging is thread-safe.
The log file can be up to 2mb in size, and when that limit is reached it discards all but the most recent 256kb and continues logging. Logged lines can be of any length. The log file name includes the date. The log file is UTF-8 and has a signature to mark it as such.
Each line in the file is prefixed with "N: " where N identifies the thread. Zero is the main thread. 1-N are Omnis Server threads.
When logging starts, Omnis writes a message to the log file, to allow the developer to identify logging being started and stopped.
Remote Debugger
Remote debugging allows you to debug your Omnis code remotely over the network. You use a development copy of Omnis Studio, the remote debug client, to connect over the network to another copy of Omnis Studio, the remote debug server. References to “the debugger” in this section refer to the remote debugger, while any references to the local Omnis Studio debugger use the term local debugger. Some key points to note:
The remote debug server runs the code that is to be debugged, and it can be any type of installation: development, fat client runtime, server or headless server.
Omnis code running in the multi-threaded server, in server stacks other than the main stack, can be debugged.
The remote debug server and client do not need to be running on the same operating system.
The version of the client must be the same or later than the version of the server.
Protected classes and locked libraries can be debugged (any locked classes with $canremotedebugwhenlocked set to False will not appear in the remote debugger).
From Studio 10.2, you can edit methods and code that you are debugging remotely by opening an ‘Edit Session’
Although the term remote debugger is used, the remote debugger client and server can be on the same computer, and in fact the client and server can be the same Omnis process. In the latter case, the remote debug client runs with some restrictions, which are discussed later.
Connectivity
The remote debug client and server always connect to each other over a WebSocket. This applies even if the client and server are running in the same Omnis process. The WebSocket connection is a direct connection from client to server, so it may require a port in the firewall to be opened on the server. As WebSocket connections start as HTTP connections, a WebSocket can be a secure TLS connection, and it can require a client certificate to authenticate the client. For the Remote Debugger, a TLS connection is always required, so the WebSocket starts as HTTPS.
An established connection between a remote debug client and server is called a remote debug session, or just session. A copy of Omnis that is running as a remote debug client or server, or both, can run only one session at a time.
Remote Debug Server
In the developer version of Omnis, you can configure the Remote Debug Server by clicking on the Options button at the bottom of the Studio Browser window (next to the revision number) and selecting the Remote Debug Server option.
In a runtime version of Omnis (not headless), if the library remotedebug.lbs is in the Startup folder, there is a menu named Remote Debug (see Remote Debug Menu below). This contains a single menu item that can be used to open the Remote Debugger window.
In the headless server you can configure remote debugging via the OS Admin window.
The Remote Debug Server window has two tabs, one to control the server, and the other to configure the server.
The Control Server tab has a single button, used to start or stop the server - the button text changes depending on the current state of the server. Until the remote debug server is started, it will not accept a connection from a remote debug client.
The Configure Server tab allows you to enter configuration details for the remote debugger server. The Configure Server tab shows fields that correspond to the entries in the configuration file. These fields are described in the following sections.
The Omnis preference $showremotedebugmenu ($root.$prefs) controls whether or not the Remote Debug menu is displayed. It defaults to kFalse, and is not saved. Therefore, if you want a library to display the Remote Debug menu, you must assign kTrue to this property in your Startup code.
Remote Debug Server Configuration file
The remote debug server configuration is stored in the file called remote_debug_server_config.json, located in the folder clientserver/server/remotedebug in the data folder of the Omnis installed tree.
You can edit this JSON file directly as a text file, or use the Remote Debug Server window, as described above.
You should note that Omnis uses a node.js server running alongside Omnis to provide the WebSocket server; this communicates with Omnis using a local in-memory socket. As a consequence, some of the configuration information stored in remote_debug_server_config.json is used by node.js. An example configuration file:
{

  "debugPort": 6102,

  "serverPfx": "server.pfx",

  "pfxPassPhrase": "xxxxxx",

  "ca": [ "server_cert.pem" ],

  "requestCert": false,

  "rejectUnauthorized": false,

  "userName": "myUser",

  "hashedPassword": "AAGGoAAAABBSEkknQUIeHQHu1sIyWxlSAAAAIHw9kvCVF4tE//SMpbSGVD/RKJLekoR7TlTvZVy3MbkJ",

  "startRemoteDebugServerAtStartup": true,

  "pauseAtStartupUntilDebuggerClientStartsExecution": false,

  "logConnectionSetup": false

  "excludeFolders": false,

  "inheritedMethodsFirst": false

}
The default server port for the remote debugger is 6102.
Debug Port
The TCP/IP port on which the WebSocket server listens for incoming connections from a client.
Server PFX
This is a file containing the server certificate and private key. It must be in the same directory as remote_debug_server_config.json. The default install tree has a self-signed certificate and key generated by the openssl command (available on any system where openssl is installed). You will need to provide your own private key and certificate. You can generate a new private key and self-signed certificate using the following openssl commands:
openssl req -x509 -newkey rsa:4096 -keyout server_key.pem -out server_cert.pem -nodes -days 1024 -subj "/CN=localhost/O=Demo" -passin pass:xxxxxx

openssl pkcs12 -export -out server.pfx -inkey server_key.pem -in server_cert.pem
This file is set as the pfx option when calling the node.js method https.createServer(). You can find more documentation about this in the node.js documentation online:
https://nodejs.org/docs/latest-v8.x/api/https.html#https_class_https_server
[https://nodejs.org/docs/latest-v8.x/api/tls.html#tls_tls_createsecurecontext_options] (https://nodejs.org/docs/latest-v8.x/api/tls.html#tls_tls_createsecurecontext_options)
PFX Pass Phrase
This is the pass phrase used to protect the Server PFX file. In the example in the previous section this is xxxxxx.
CA
See https://nodejs.org/docs/latest-v8.x/api/tls.html#tls_tls_createsecurecontext_options for more details. You would typically only set the CA when using a self-signed certificate, in which case it has a single entry. In the Server PFX section above, the certificate was signed using server_cert.pem. The general value of this is a comma-separated list of trusted CA certificate file names. The files must all be in the same directory as remote_debug_server_config.json.
Request Client Certificate
A Boolean option. If true, the node.js server requests a client certificate to authenticate the client. The client certificates are discussed later, in the client connectivity section.
Reject Unauthorized
A Boolean option. If true, the server will reject any connection which is not authorized with the list of supplied CAs. This option only has an effect if Request Client Certificate is true.
User Name
If not empty, the WebSocket connection also uses HTTP basic authentication to authenticate the user, in which case this field contains the user name used for HTTP basic authentication.
Hashed Password
If the User Name is not empty, this is the PBKDF2 hash of the password required for HTTP basic authentication.
Start Remote Debug Server
This Boolean option controls whether the remote debug server automatically starts when Omnis starts.
Pause Execution At Startup
If the remote debug server is configured to automatically start when Omnis starts, you can set this Boolean option to true to make Omnis pause execution at startup before it runs the startup tasks of libraries in the startup folder.
When using this option, Omnis displays a working message (Waiting for remote debug client to start execution…), and enters a loop where it waits for a remote debug client to open a session. Once a session is opened, Omnis remains in the loop, where it is now waiting for a command from the client to start execution. During this loop, the client can inspect remotely debuggable code, and set breakpoints for example.
The loop terminates either when the client sends a command to run startup, or when the remote debug session closes, or when a user clicks the cancel button on the working message displayed on the server. When the loop terminates, Omnis runs the startup tasks for the libraries in the startup folder.
You can also Exclude folders from class lists, and Show inherited methods first in the method list in the remote debugger code editor.
Remote Debug Client
The remote debug client is accessible via a new node in the Studio Browser tree, “Remote Debug Client”. It uses a similar session model to the Omnis VCS. When you click on the Remote Debug Client node in the tree, hyperlinks appear in the browser panel for Session Manager, and Open Session.
The session manager allows you to configure remote debug sessions. Each session provides the parameters that allow the remote debug client to establish a WebSocket connection to a remote debug server. These parameters are described in the following sections.
Name
A name that identifies the session.
Server
The IP address or DNS name of the remote debug server.
Debug Port
The debug port configured for the remote debug server. When connecting to the server, the client connects to a URL of the form
wss://Server:DebugPort
Client Certificate
If the server requires a client certificate, you specify this here.
You can generate a client certificate using the openssl commands:
openssl req -newkey rsa:4096 -keyout client_key.pem -out client_csr.pem -nodes -days 1024 -subj "/CN=192.168.1.11" -passin pass:xxxxxx

openssl x509 -req -in client_csr.pem -CA server_cert.pem -CAkey server_key.pem -out client_cert.pem -set_serial 01 -days 1024
Note that this uses the server key and server certificate generated in the example for the Server PFX field of the remote debug server configuration. The client certificate needs to be installed on the client machine.
On Windows, generate a client.pfx file:
openssl pkcs12 -export -out client.pfx -inkey client_key.pem -in client_cert.pem
Import client.pfx into the windows certificate store: double click on the pfx, add to Personal certificates for the current user.
On macOS, generate a pkcs12 file:
openssl pkcs12 -export -out client.p12 -inkey client_key.pem -in client_cert.pem
Double click on the file to add it to the keychain.
You can find more details about this in the CURL documentation at:
https://curl.haxx.se/libcurl/c/CURLOPT_SSLCERT.html
Note the Client Certificate parameter is the value passed to the CURL option CURLOPT_SSLCERT.
On Windows, the client certificate parameter is a path expression to a certificate store e.g.
CurrentUser\MY\afe2179599460d20da08c12e8c328d84bd300735
where afe2179599460d20da08c12e8c328d84bd300735 is the thumbprint viewed by double clicking on certificate in the MMC (MMC certificate snap-in view, details tab, thumbprint field).
On macOS, you can specify either the path of the p12 file, or the keychain name of the client certificate.
User Name
If the server uses HTTP basic authentication, the user name required for that.
Password
If the server uses HTTP basic authentication, the password required for that. Alternatively, you can leave this empty, and the client will prompt for the password when it is required.
Server Connection Logging
You can monitor the client connection to the Remote debugging server, which allows you to highlight any connection problems. You can enable logging in the remote debug client window (or in the config file in the logConnectionSetup item).
If enabled, the Remote Debug Client writes a log file named <session name>.htm to the logs/remotedebug folder, containing a log of what occurred when attempting to connect to the remote debug server. Note that the log is not written until the connection closes.
Preparing Code For Remote Debugging
You have to enable remote debugging in the library, and in the task instance (remote or standard for fat client), by setting the $remotedebug property.
Library
By default, a library cannot be debugged by the remote debug client, meaning that when the remote debug client connects to a server, the library will not appear in the client interface. If you wish code in a library to be debugged with the remote debugger, you need to set a new library property, $clib.$remotedebug: if true, remote debugging of this library is allowed, but it cannot be set to true in an always private library, which means you must set this property to true before making the library always private.
Task
Setting $clib.$remotedebug allows the library and its classes to appear in the remote debug client interface. This allows you to browse the code and set breakpoints. However, only tasks and remote tasks marked for remote debugging will react to these breakpoints. This provides more control over debugging, and specifically in the multi-threaded server, it prevents one breakpoint from stopping every client that hits it.
To mark a task or remote task for remote debugging, set the $remotedebug property of the task instance to kTrue.
In addition, you can set this property of a remote task by adding a query string parameter to the URL used to open a JavaScript client form or execute an ultra-thin request: omnisRemoteDebug=1, for example:
http://127.0.0.1:5981/jschtml/jsDragDrop.htm?omnisRemoteDebug=1
Locked Classes
You can debug methods in a locked class if the $canremotedebugwhenlocked property in the class is set to true. Locked classes for which this property is kFalse do not appear in the remote debug client list of classes for the library.
Opening a Session
To use the remote debugger client after configuring a session, click on the Remote Debug Client node in the Studio Browser tree, click on either Open Debug Session (read-only), or Open Edit Session hyperlink, and then click on the hyperlink for the session you want to use. This will cause the client to establish a WebSocket connection to the server. While the connection is being established, progress is displayed in the browser panel, although this is usually very quick. In addition, a Cancel Open Session hyperlink is displayed while the connection is being established.
Edit Session
An “Edit session” allows you to edit methods via the remote debugger, that is, you can apply edits, and you can create new variables via the fix error dialog. Note that until you try to save the method back to the server, you will not know for sure if the method will be accepted, since only part of the library is available when editing - you can use instance, class, local, task and parameter variables (from the class or a superclass) or any file class variable in a file class used by the method. Using variables from other file classes, or using notation, functions or commands available on the server (but not the client), will be displayed as an error if you edit a line containing something only available on the server. However, you can still save the method successfully in this case.
In edit mode, methods default to read-only in the remote debug window. You need to explicitly press "edit method" in the toolbar to edit the method, after which you cannot do anything else with the window until you press Save or Cancel or close the window.
Debug (read-only) Session
A “Debug session” (read-only) allows you to view and step through code in the remote debugger, but you cannot edit the methods or add variables. The remainder of this section describes remote debugging for a debug session, but an edit session has the same operation except for the above caveats.
Browsing Libraries
After the session opens, libraries marked for remote debugging appear in both the browser tree and the browser panel. The Remote Debug Client child nodes have similar behavior to the Libraries node child nodes, so they include both libraries and folders within the libraries. When you select a child node, the browser panel updates to show the content of that node - this comprises a list of all classes that can contain code.
While any node in the remote debug client sub-tree is selected, a Close Session hyperlink is displayed. In addition, if a single class is selected in the browser panel, a hyperlink named “Open debug window” is displayed. You can click on this (or double click on a class in the panel) to open the remote debug window for the class.
If the server is paused, waiting to run startup, the hyperlinks include a link named “Run Startup” that can be used to tell the server to carry on and run its startup processing.
Save Window Setup for the browser window remembers column positions for the list view of the remote debug client panel.
The status bar of the browser window includes the name of the currently open session.
Excluding Folders
The Remote Debug Server configuration has the ‘Exclude folders’ option which controls whether or not folder names are returned by the server to the client, and therefore displayed in the browser. The remote debug server dialog allows you to edit this option.
The Remote Debug Window
The remote debug window has a similar layout to the Method Editor. The main difference is that it always shows the debug panel (there is no editor panel). The window shares both its fonts and keyboard shortcuts with the method editor. So if you open the Fonts… dialog from either of these windows, you are editing the same configuration information (stored in keys.json under methodEditorAndRemoteDebugger).
From left to right, the toolbar controls are as follows. Note that there is no configuration mechanism to change these.
Back
Navigates to the previous method in the history stack for the window. Note that unlike the method editor, there is a separate history stack for each remote debug window. This allows operations such as open superclass methods and open specified class to operate within the context of a single window, and also works more appropriately when you have several windows all paused at a breakpoint.
Forward
Navigates to the next method in the history stack for the window.
View
Open specified class is similar to the Modify Specified Class command in the method editor - when a method line is selected, it opens the method referred to by the command, if one can be identified.
In addition to a context menu command in the tree, the View menu also has a command to go to the superclass methods if relevant (also available on the Modify menu for the method editor).
Find
This allows you to perform find operations on the currently selected method.
Instance
The remote debug window can be associated with an instance. This allows you for example to view instance specific methods or objects that have been added during runtime execution. The instance menu allows you to close the instance, detach the debugger from the instance, or attach the debugger to an instance. Note that this menu is disabled as soon as the remote debug window becomes associated with some executing code (by hitting a breakpoint).
Stack
When execution is paused this allows you to select items on the call stack, or clear the stack.
Go, Step In, Step Over, Step Out
Like the standard method editor, these commands allow you to start execution (Go) and step through your debuggable code. The step commands step until the next debuggable command, so if code which is not debuggable is encountered execution will not pause there.
Go Point
This allow you to set the go point to a different line in the method at the top of the call stack.
Breakpoints
This allows you to manage breakpoints. Note that the method editor has also been changed to remove individual Breakpoint and One-time breakpoint buttons, and use a similar menu to this for consistency.
The Set Condition… command allows you to set a condition on a breakpoint. The condition is a calculation that must evaluate to true for the breakpoint to pause execution. The condition dialog provides some code assistance, by using variable names (of task, class, instance, local, parameter and event parameter variables) present in the currently displayed method.
Note that the code panel and the breakpoint panel both provide alternative ways to work with breakpoints, in a similar way to the method editor - so the left column of the code panel can be used to set and clear breakpoints, and the breakpoints panel has a context menu to do this. Set Condition… is not available in the breakpoints panel context menu, because the method affected may not currently be displayed.
Variable panel
The Variable panel in the Method Editor will be populated while debugging your code remotely, and allows you to view and modify variables.
Keeping the Client in Step with the Server
You should bear in mind that the set of libraries and instances being debugged can change on the server. Omnis keeps the client up to date with the server using a combination of notifications sent from the server, and lazily applied updates to the client. For example, if a library closes on the server, the client is informed, and it updates the interface to reflect this - this means it removes it from the browser tree, and closes any remote debug windows for classes in the library. However, if a method changes on the server, the client will not receive the updated method until it requests it again - note that each time the client performs a debug operation, e.g. step over, the client will request the method when the action completes - if the method has changed on the server, the client will receive a new copy as part of the step action.
Execution
Execution Contexts
An execution context is either the main thread or a remote task instance. When execution suspends for an execution context, the remote debug client looks for the debug window associated with the context, and uses that. If there is no debug window for that context, the client looks for a suitable open remote debug window for the class, and if one exists that is not associated with a context it will use it, and associate the window with the context; otherwise the client opens a new window and associates it with the context. Once a window is associated with an execution context, all debugging for that context occurs in that window. A window associated with an execution context can only be closed if execution is not currently paused.
This approach means you can be simultaneously debugging several remote task instances for example. Each execution context uses a single window.
All in one process
As stated earlier, the remote debug client and server can be the same process. In this case:
When execution suspends in the main thread, the remote debug window for the main thread context becomes fully modal.
You cannot debug code running in a critical block in the multi-threaded server.
Errors
If an error occurs during Omnis code execution, e.g. Open window instance with a bad window name, and the line of code causing the error is remotely debuggable, the remote debugger pauses execution at the line causing the error.
Local Debugger
While the remote debugger is attached to a copy of Omnis, the local debugger is disabled in that copy. This also affects the ability to right click and view variable values.
Omnis Language
There is a new sys() function, sys(238) that returns a Boolean which is true if the remote debug server has been started.
Remote Debugger In Control
When the remote debug server and client are not the same process, and execution is suspended for the main thread on the server, the following window appears on the server (this does not apply to the headless server):
While this window is displayed, the only action that can be performed on the server is a click on the button to stop the remote debug server, and run (meaning execution continues from where it was paused).
Note that if you do choose to stop the server, then the session will close on the client, and all remote debug windows open on the client will close. If you subsequently restart the server (without restarting Omnis), and open a new session from the client, any breakpoints set for the previous session will still be set.