Omnis Technical Note TNJC0014Updated Mar 2025
Integrating AmCharts into Omnis Studio
for Omnis Studio 10.22 or above
By Roberto Riccardi, SoftPI (https://www.SoftPI.com/)
Editor’s note: We are very grateful to Roberto Riccardi of SoftPI for writing this tech note and creating the sample library, and for allowing us to publish it on the Omnis website. Software Products Italia is the exclusive distributor of Omnis products and services in Italy, Spain, Portugal, Mexico, plus Central & South America.
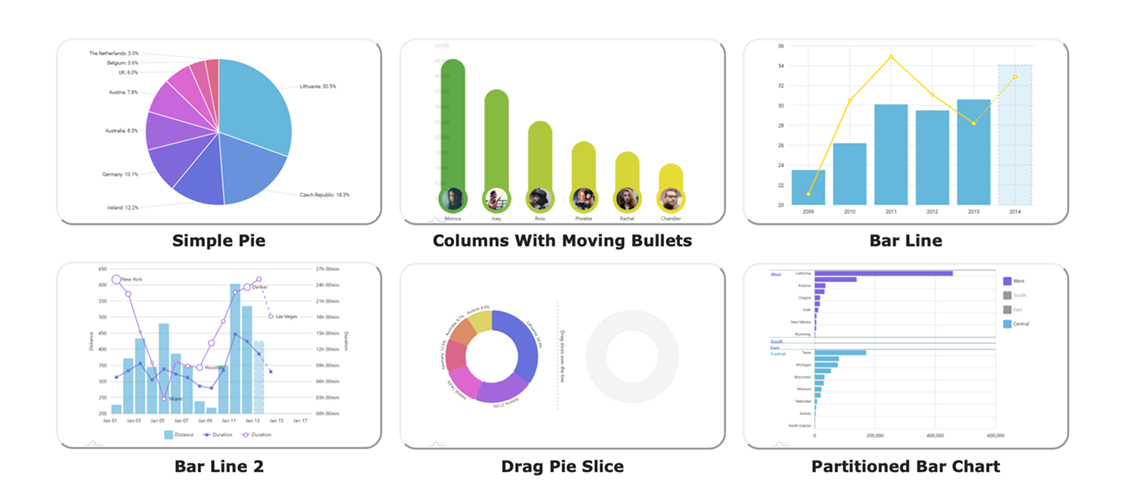
This Tech Note describes how you can integrate AmCharts into Omnis Studio 10.2 without having a deep knowledge of Javascript. You can draw a vast array of charts using the AmCharts Javascript libraries (see https://www.amcharts.com) which can then be displayed in an Omnis Remote form for use in your Omnis web and mobile applications. There is a sample library (Graphics_AmChart.lbs) and required html with the Tech note, available to download in this file: Omnis_AmCharts102.zip, which shows how you can create 12 different AmCharts in Omnis Studio, including:
-
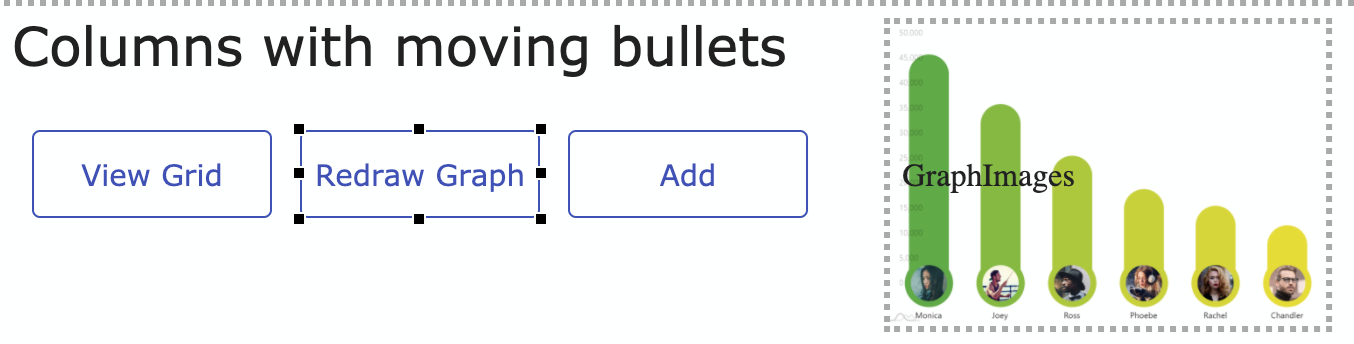
Simple Pie chart, Columns with Moving Bullets, Bar Line chart
Bar Line 2, Drag Pie Slice, Partitioned Bar Chart
Divergent Stacked Bars, Day Timeline, Map with Pulsating Bullets
Stadium Track chart, Variance Indicator, Drill-down Treemap
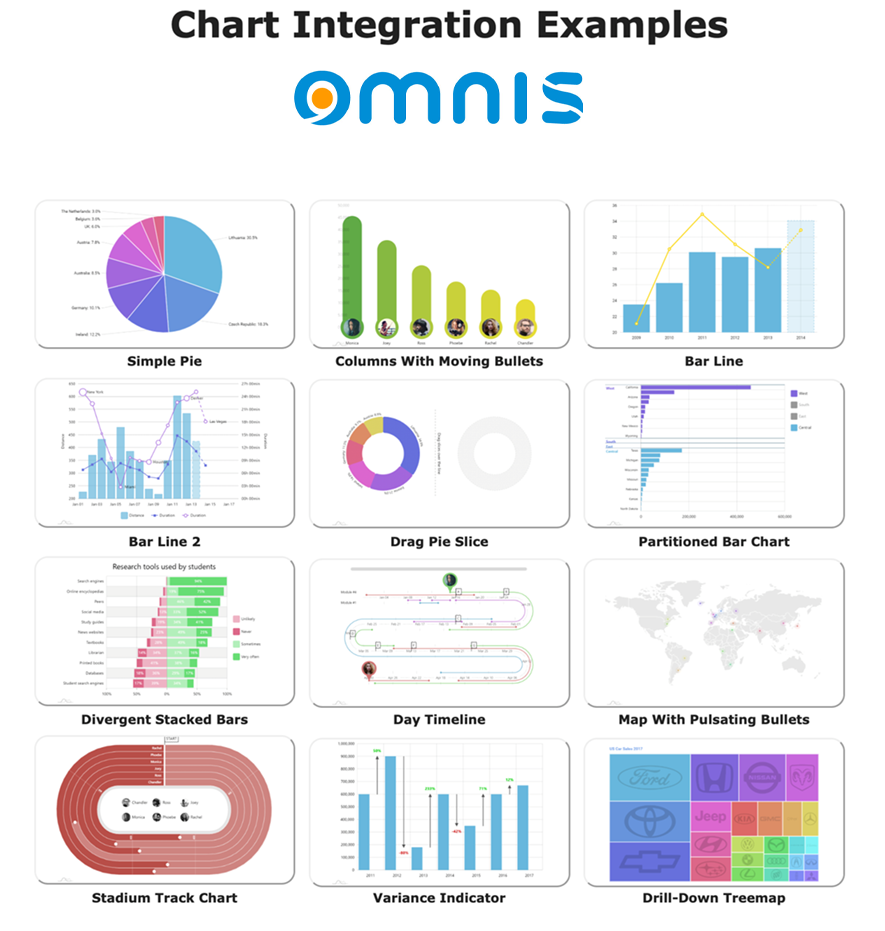
The following example (animated Gif) shows the interactivity and animations available in the Drill-Down Treemap chart type where you can "drill-down" into the data by clicking on a major category to reveal further data for each category, in this case, data for US car sales for major auto manufacturers.
Prerequisites to be included in the HTML page
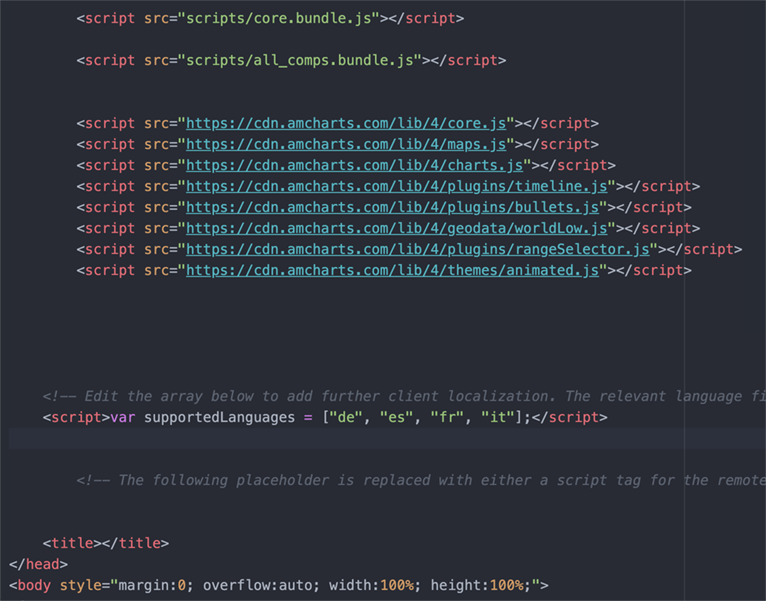
Before starting the explanation, it is necessary that the html page where the Omnis Studio library and the AmCharts will be executed contains the references to the JavaScript code necessary for the execution of AmCharts.
These references must be placed in the Header section of the HTML page containing the remote form: see the example Html provided in the download (jsAmChart.htm). (If you do not use the Html provided, these script references need to be added to your Html that contains the jsAmChart Remote form, or add it to jsctempl.htm in the 'html' folder.) This is the code that needs to be added:
<script src="https://cdn.amcharts.com/lib/4/core.js"></script> |
The following image shows the example html page:
How AmCharts Works
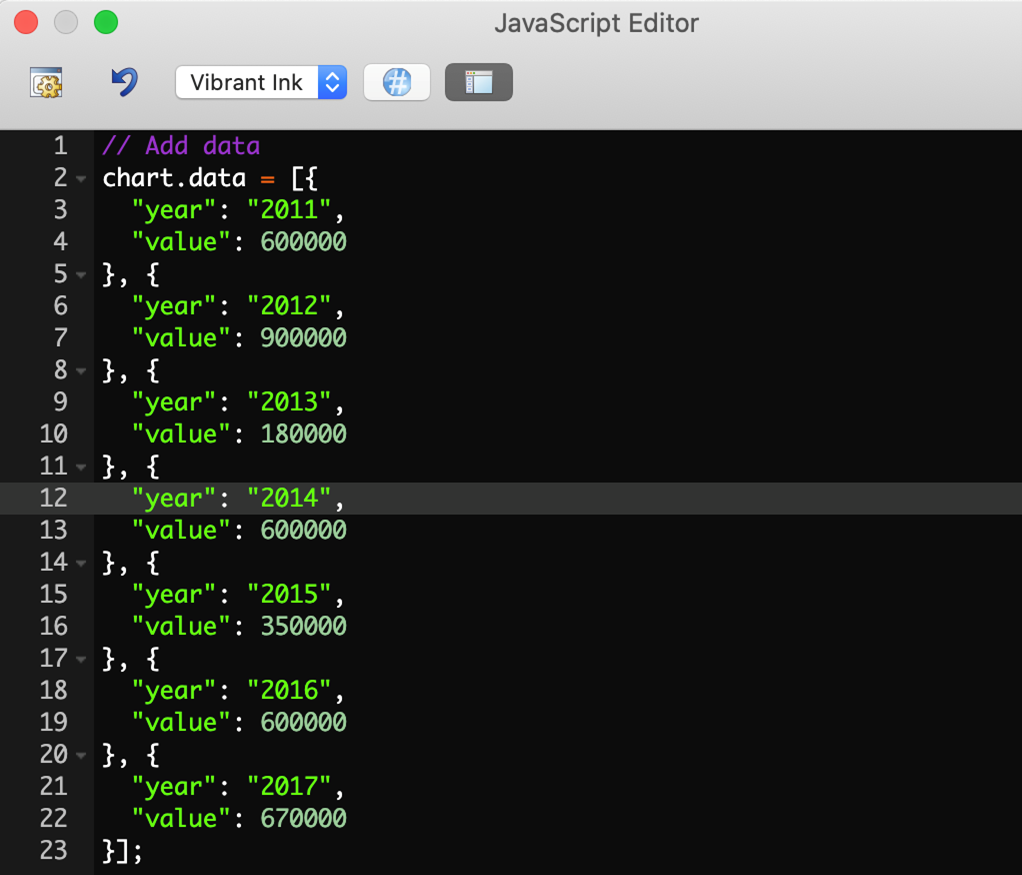
The following images shows the basic JavaScript instructions:
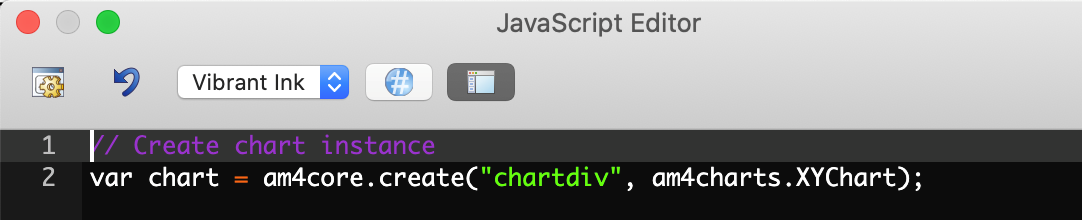
The previous JavaScript instruction creates a new chart instance (var chart) of a “am4charts.XYChart” class and puts the new instance in a specific html “div”. In this case an html “div” with id = “chartdiv”.
This second JavaScript instruction shows how to load the data inside the chart instance previously created. The format of the data is a simple JSON format and has been assigned to the “data” properties of the chart instance (chart.data = ...)
Based on these two elements it is now possible to integrate the new component into an Omnis Studio remote form class following the next steps.
How to encapsulate the AmChart in Omnis Studio
First of all we need to put an html “div” inside an Omnis remote form. This is possible by adding the “HTML component” in a remote form and assigning the correct information in the “html” property of the “HTML Component”.
A possible value of the html property could be the following:
“<div id="chartdiv" style="width: 100%; height: 500px;"></div>” |
And this is how the example library works.
In the sample library each AmChart is inside a specific remote form and each remote form contains an “HTML object” (name of the object “HtmlObj”). The “html” property has been populated with the getDiv method.
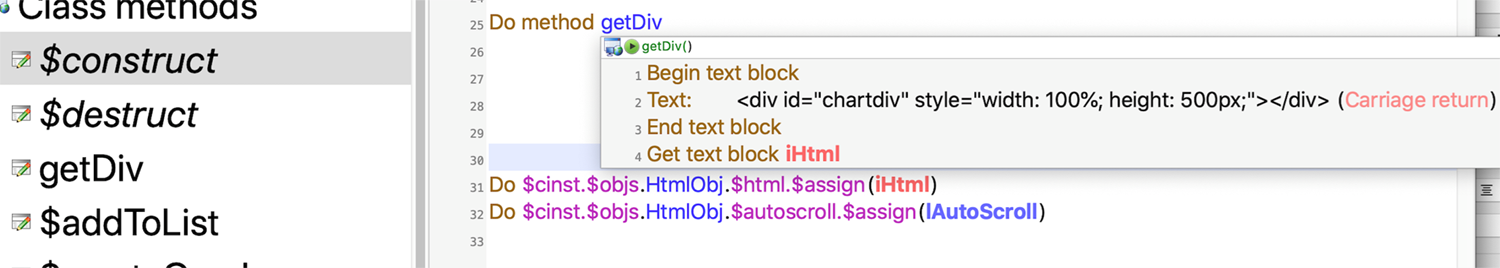
The link with the JavaScript code that we have analyzed before, is the “id” of the “div”. It must be the same! In this example “chartdiv”.
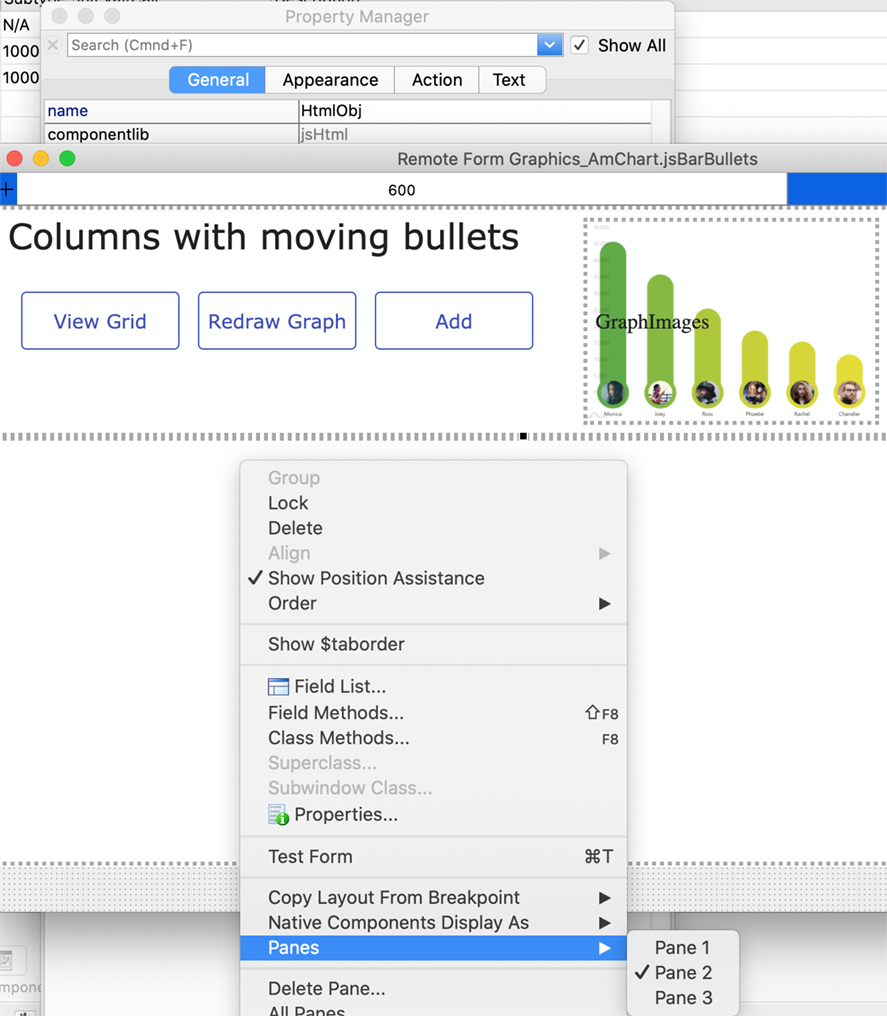
The “HtmlObj” is present in each remote form for each chart inside the Omnis Library. The next image shows the remote form “jsBarBullets”.
How to execute the AmChart in Omnis Studio
The second step to execute inside Omnis is to create the JSON values that the chart needs.
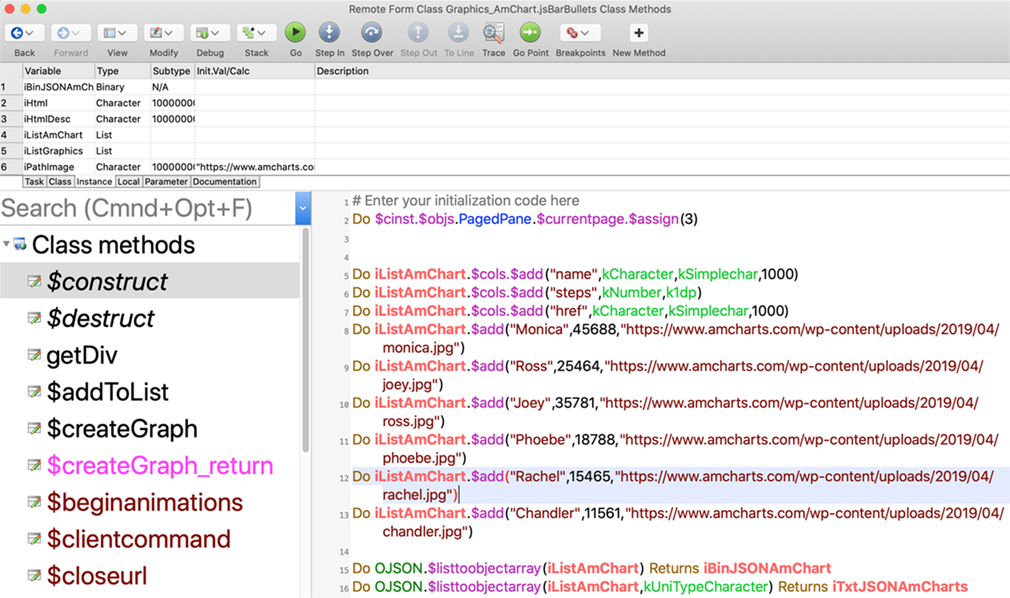
In the $construct method of each remote form a list “iListAmChart” is constructed with the same fields as the JSON used by the corresponding AmChart. It is important to know that each AmChart uses a different JSON format of the Data.
The following is the $construct method of remote form “jsBarBullets”.
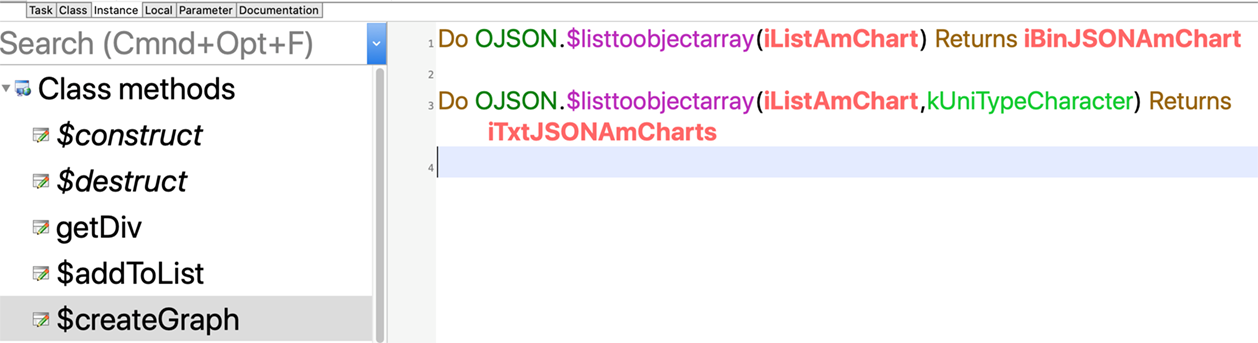
When the “iListAmChart” has been populated, it is possible to create the JSON Data with the static method “$listtoobjectarray” in the OJSON external component in Omnis Studio.
The next statement has been used to create a “char” variable of the JSON.
Do OJSON.$listtoobjectarray(iListAmChart,kUniTypeCharacter) Returns iTxtJSONAmCharts |
The next step is to pass the “char” (JSON) variable to the JavaScript code.
As mentioned before, in the sample library each AmChart is inside a specific remote form and the “client” execution, i.e. the JavaScript execution, is inside a remote object, one for each AmChart.
The following is the “Bar Bullets” remote object class named “oBarBullets”. There is a $createGraph client method that executes the chart JavaScript code:
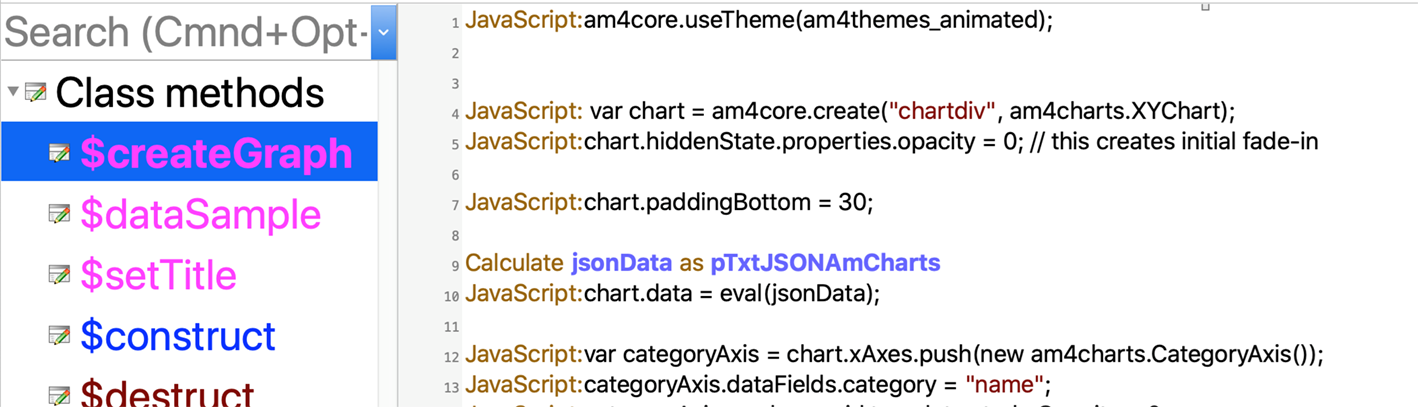
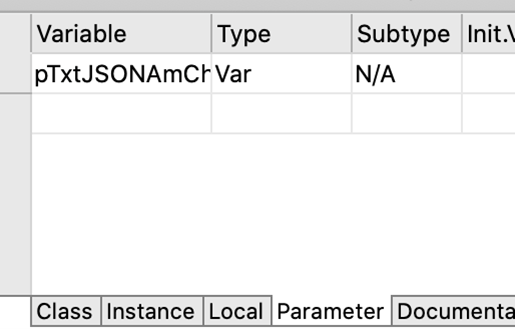
It has a “pTxtJSONAmCharts” input parameter.
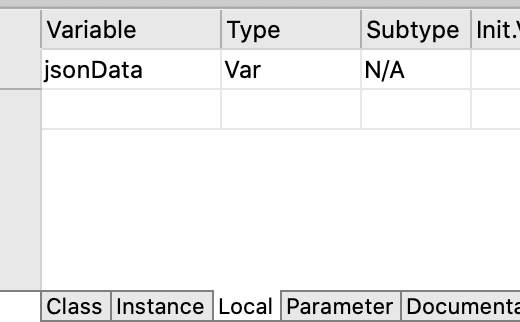
The type of the parameter and the local variable “jsonData” is “Var”.
The statement “chart.data = eval(jsonData)” copies the Json value of the Omnis list into the data property of the chart JavaScript.
The last issue is how to pass the Json data generated in a Server method (the OJSON object exists in the Omnis Server, not in the Client) to a client Omnis Method. This is important because if you want to change the data in the Omnis list, you want the changes to be reflected in the chart.
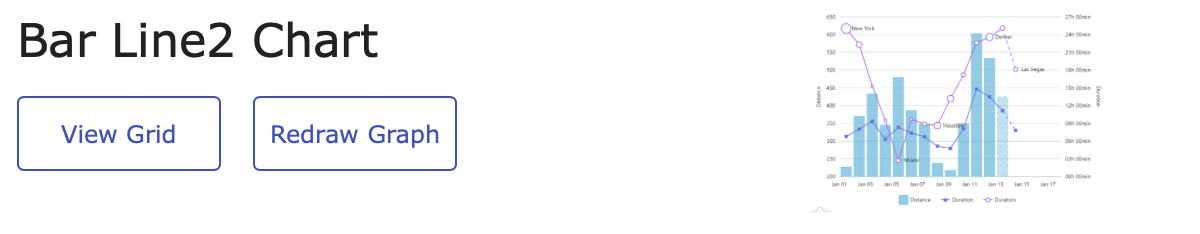
The “View Grid” button allows you to change the initial list in the Data grid or with the “Add” button, if present, will add another data point.
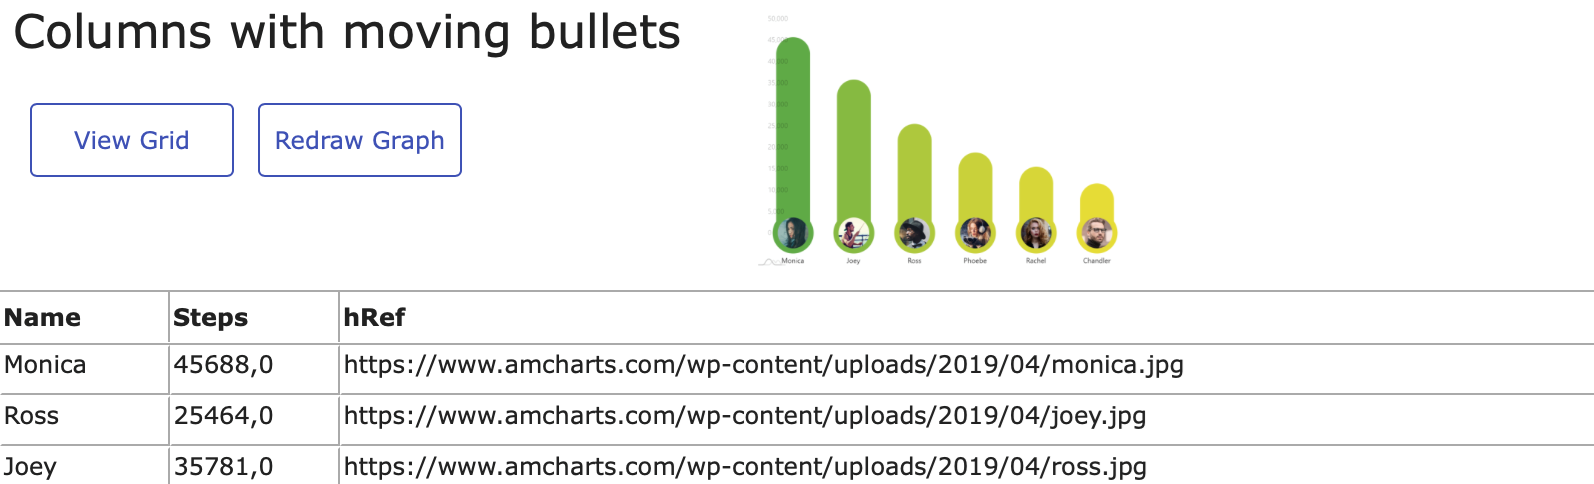
After changing the data with “View Grid” or the “Add” button, you must press the “Redraw Graph” button to refresh the Chart using the new Data of the Omnis List.
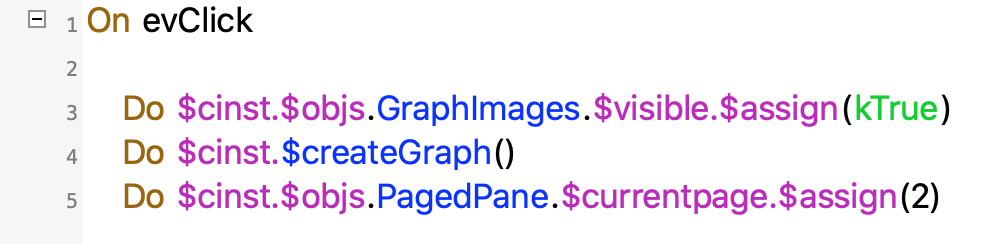
The $event method of the “Redraw Graph” button is a client method that calls the $cinst.$createGraph() server method that will change the “iTxtJSONAmCharts” variable.
$event “client method”
$createGraph “server method”
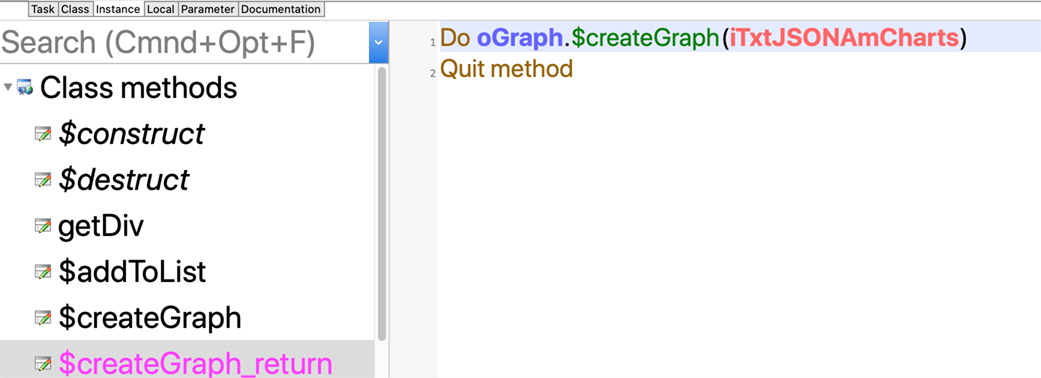
In the remote form there is another client method “$createGraph_return” that will be executed on the client when the server method “$createGraph” has ended execution on the server.
In a remote form, when a server method is executed from a client method, it is possible to insert a client method “[server method name]_return” that will be executed on the client (in the browser) at the end of the execution of the server method.
When the client method “$createGraph_return” starts on the client, Omnis will already have synchronized the “iTxtJSONAmCharts” in the client from the Omnis server.
Then the client method “$createGraph_return” will execute the call to the remote object client method to reload the new Chart, passing the “iTxtJSONAmCharts”.
And that’s all!
Running the Example
To run the sample library, first copy the jsAmChart.htm file into the “html” folder in the Omnis tree in your “appdata” (Windows) or “Application Support” (Mac) directory. Make sure the Graphics_AmChart.lbs library is open in Omnis.
Set the “server port” number of Omnis in the $serverport property (click on Omnis Studio in the Studio Browser, click on Prefs and find $serverport in the Property Manager, see below).
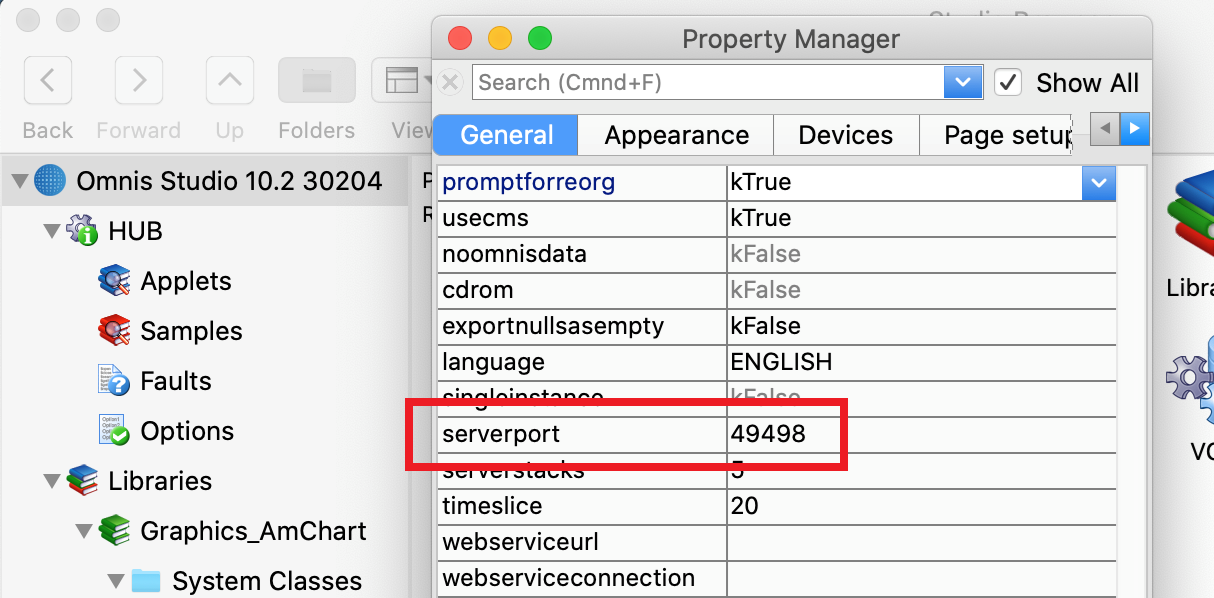
Open your desktop web browser and enter the correct address. For example, http://127.0.0.1:49498/jschtml/jsAmChart.htm, but change the “server port” number in the URL to your port number (e.g. 49498).
When the page has been opened, click on a Chart in the index page; you will see a sample layout (clicking on the sample layout goes back to the index). Note the library would need to be adapted to cater to mobile devices as well, but this is just a layout issue.
Click on “Redraw Graph” to see the live AmChart. For example, try the "Bar Line2" chart, then click “Redraw Graph” to see the live chart, then hover your pointer over the data points to reveal the detailed data. The following animated Gif shows the type of animations available in the "Bar Line 2" chart from AmCharts.
Click on “View Data” to change the data in the grid and then “Redraw Graph” to see any changes.
Click on the “thumbnail” graph image at the top of the remote form to go back to the index page.
I hope you enjoy the Omnis AmCharts Integration! Roberto.
Please contact Roberto at SoftPI if you have any questions, at: mktg@softpi.com


 Please logon or create a free account to download this file.
