Omnis Technical Note TNJC0017Sept 2022
Bar and Pie Chart Controls
for Omnis Studio 10.2 or above
By Omnis Engineering
You can use the Bar chart and Pie chart JavaScript components available in Omnis Studio to represent data to add a highly visual appearance to your web and mobile apps. This tech note shows how you can create an example form containing a Data grid and both types of chart, while using a two-column list of sales data: this could easily be adapted to add data visualization to your own apps.
For more complex types of data and other chart types, you could use a third party Chart component in your JS remote forms, such as AmCharts, as described in this tech note. This tech note assumes you can use the Property Manager to set property values, and the Code Editor for some simple coding. It also shows how you can use the $edgefloat property for controls, in different layout breakpoints in a remote form, to make the controls responsive to the form resizing or being displayed on different devices.
Creating a form and Data grid list
To try out Bar and Pie charts in Omnis, you need to create a JavaScript Remote form, add a Data grid and a data list, then add the chart components (or to save time, you can download the finished library here). You can download the Community Edition of Omnis Studio, free of charge, and create the app described in this tech note.
Go to the Studio Browser and create a blank/empty library (click on Libraries, then New Library and choose Blank Library), name it charts.lbs. Your library needs a Remote task and if you're using the Community Edition your library will contain a Remote_Task, so you can use this. otherwise for other editions of Omnis Studio you need to create a Task class (name it anything, e.g. jstask).
Next create a Remote Form and name it jsCharts. The remote task in your library will be assigned to the remote form automatically (in the form property $designtaskname).
Double-click on the remote form to open it in design mode. Open the Component Store or bring it to the top (press F3/Cmnd-3) and drag a Data Grid component onto your remote form (you can Right-click and select the Text option to see the component labels, as shown below). Position the Data Grid in the top-left corner of the form.
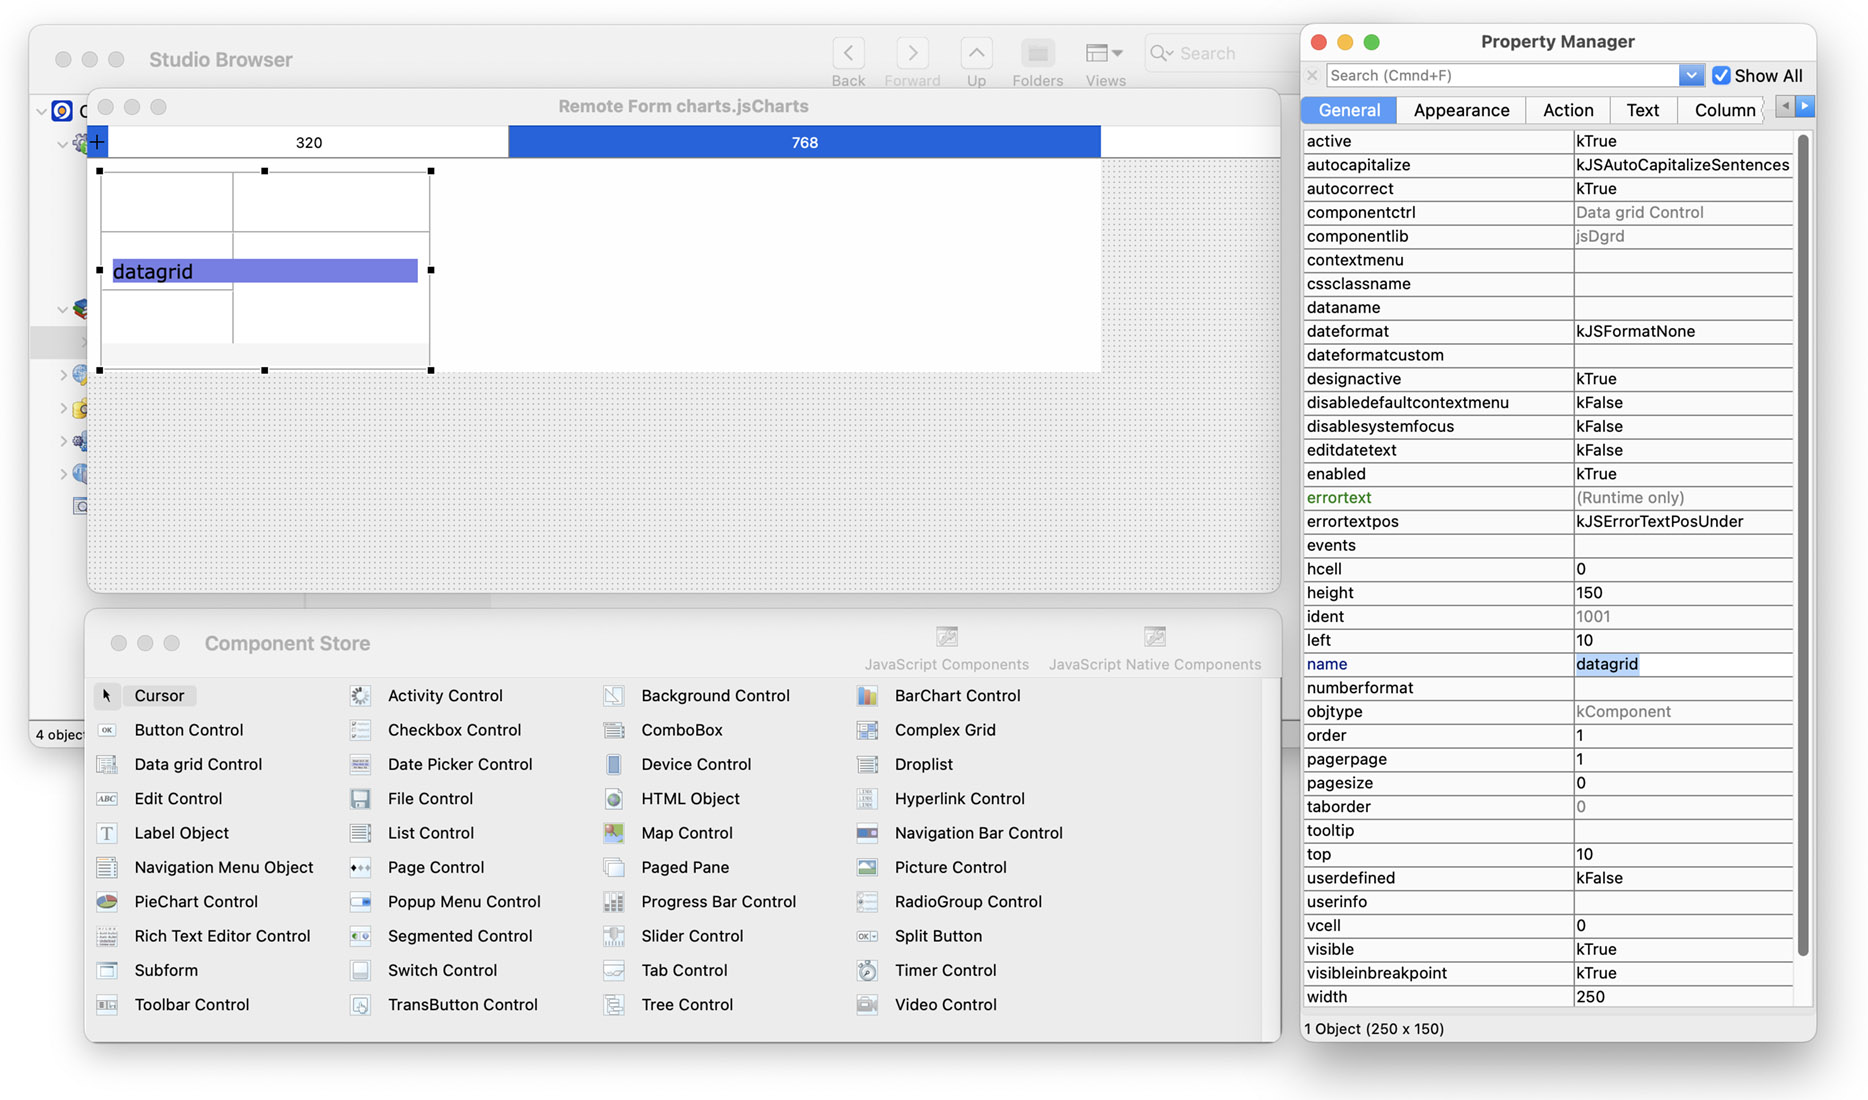
Using the Property Manager, set the following properties. You can use the Search box at the top of the Property Manager to locate each property, otherwise they appear on separate tabs, e.g. General and Appearance; note the Show All option should be checked.
$name = datagrid
$height = 240, $width = 180
$designcols = 2 (on the Appearance tab)
$columnnames = Sales,Region (click the down arrow to enter)
$::$columnwidths = 80,80
$::rowheight = 0 (so the row height is calculated automatically)
$autoedit, $enterable, $extendable = kTrue (on the Action tab)
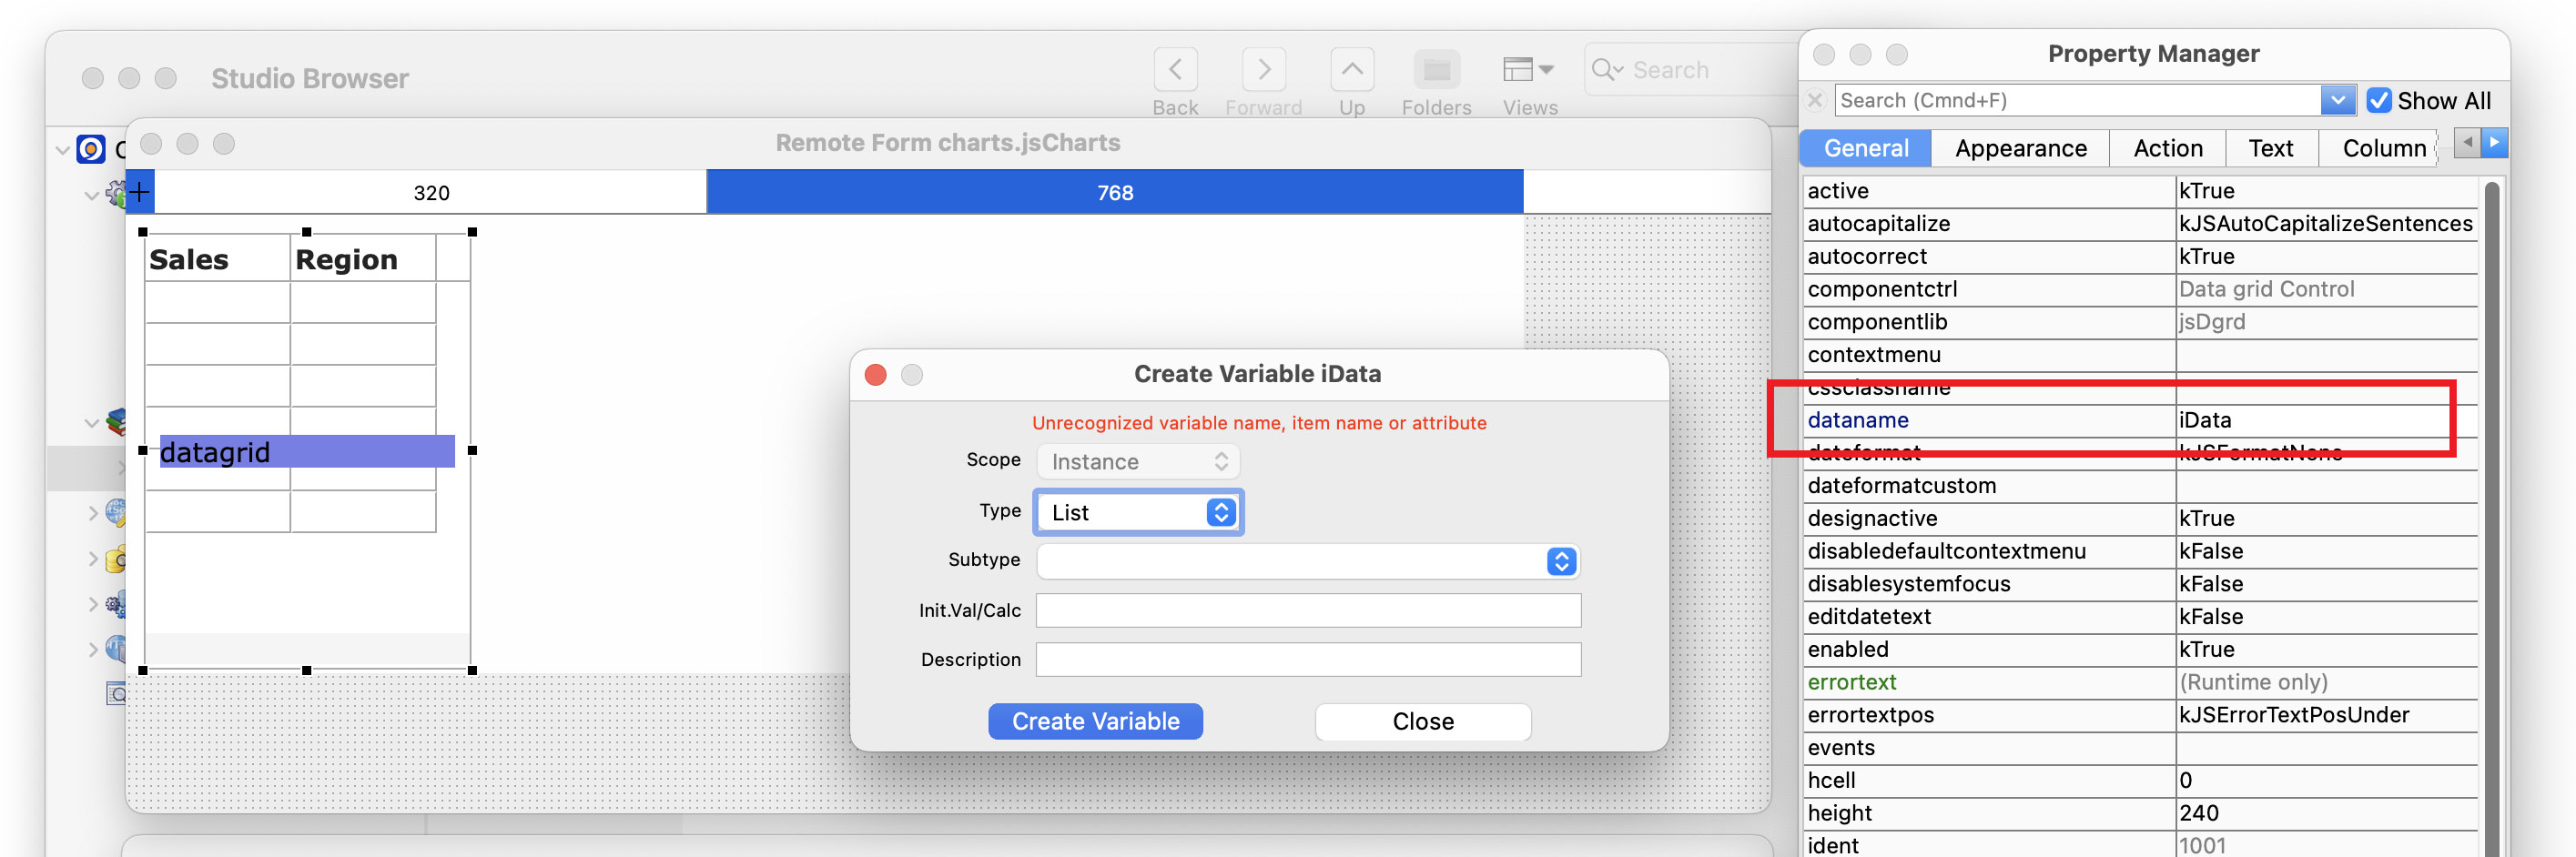
Lastly you need to set the $dataname property of the grid to the name of a list instance variable: click into $dataname in the Property Manager and enter iData. As you tab out of the $dataname field, Omnis will prompt you to create the variable: it will suggest an Instance variable of type List, which is what you want, so in this case, accept it by clicking on the Create Variable button.
Adding some data
Before adding the charts, you need to add some data to be displayed in the form: for your own purposes you would build the data from a database, but in this demo, you can build a static list of sales data. Bar and Pie charts require a simple two-column list containing the Value in the first column and the Label in the second column: in our demo, we are using Sales and Region to represent the value and label.
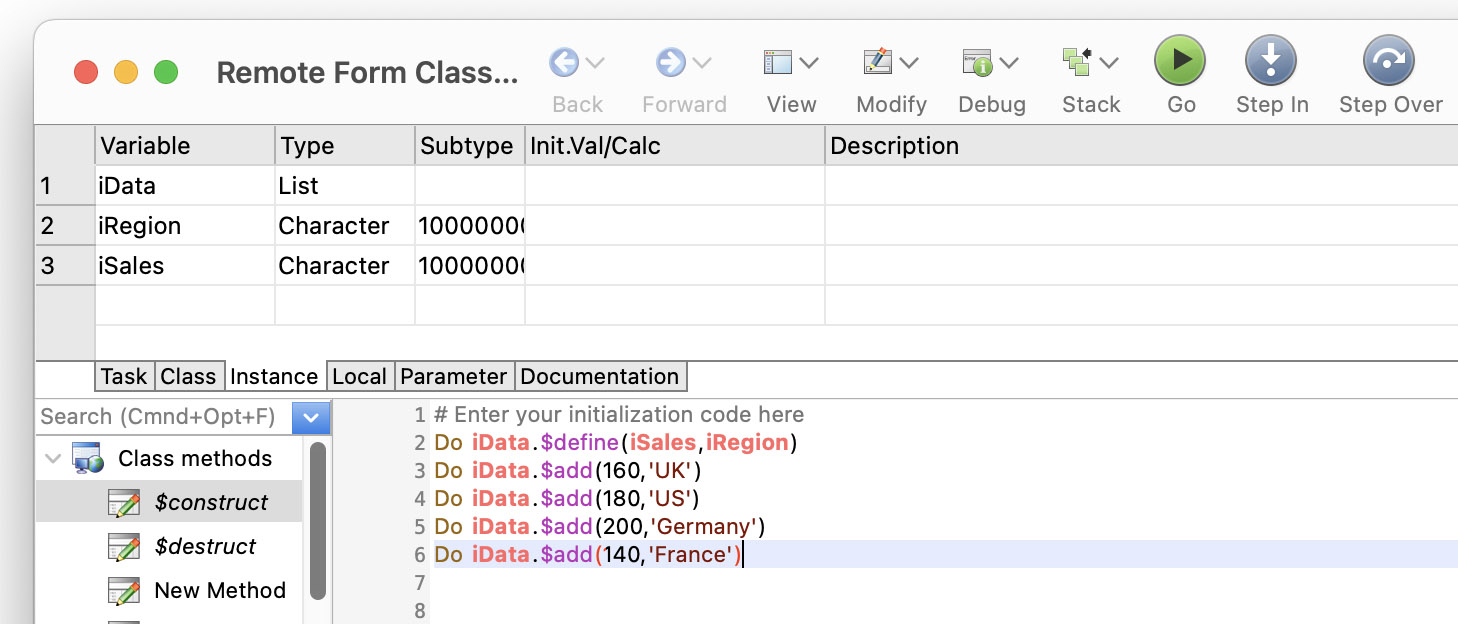
To create and build a data list, you can create a method in the $construct method of the remote form, which will create a list of sales data when the form is opened. To do this, double-click on the background of the form (not the data grid) to open the Method Editor: the $construct method should be selected by default. Click into the first empty line and enter the following code, or Copy the code from this page and Paste it into the Code Editor.
Do iData.$define(iSales,iRegion) |
The iSales and iRegion variables do not exist (at this stage they will not be colored in the code), so after you have typed the first line (or pasted in the method text), click into each variable name and click the ‘Fix’ button (blue with check mark) at the bottom of the Code Editor to create the variable: you can accept the suggested Instance variable of type Character for both variables.
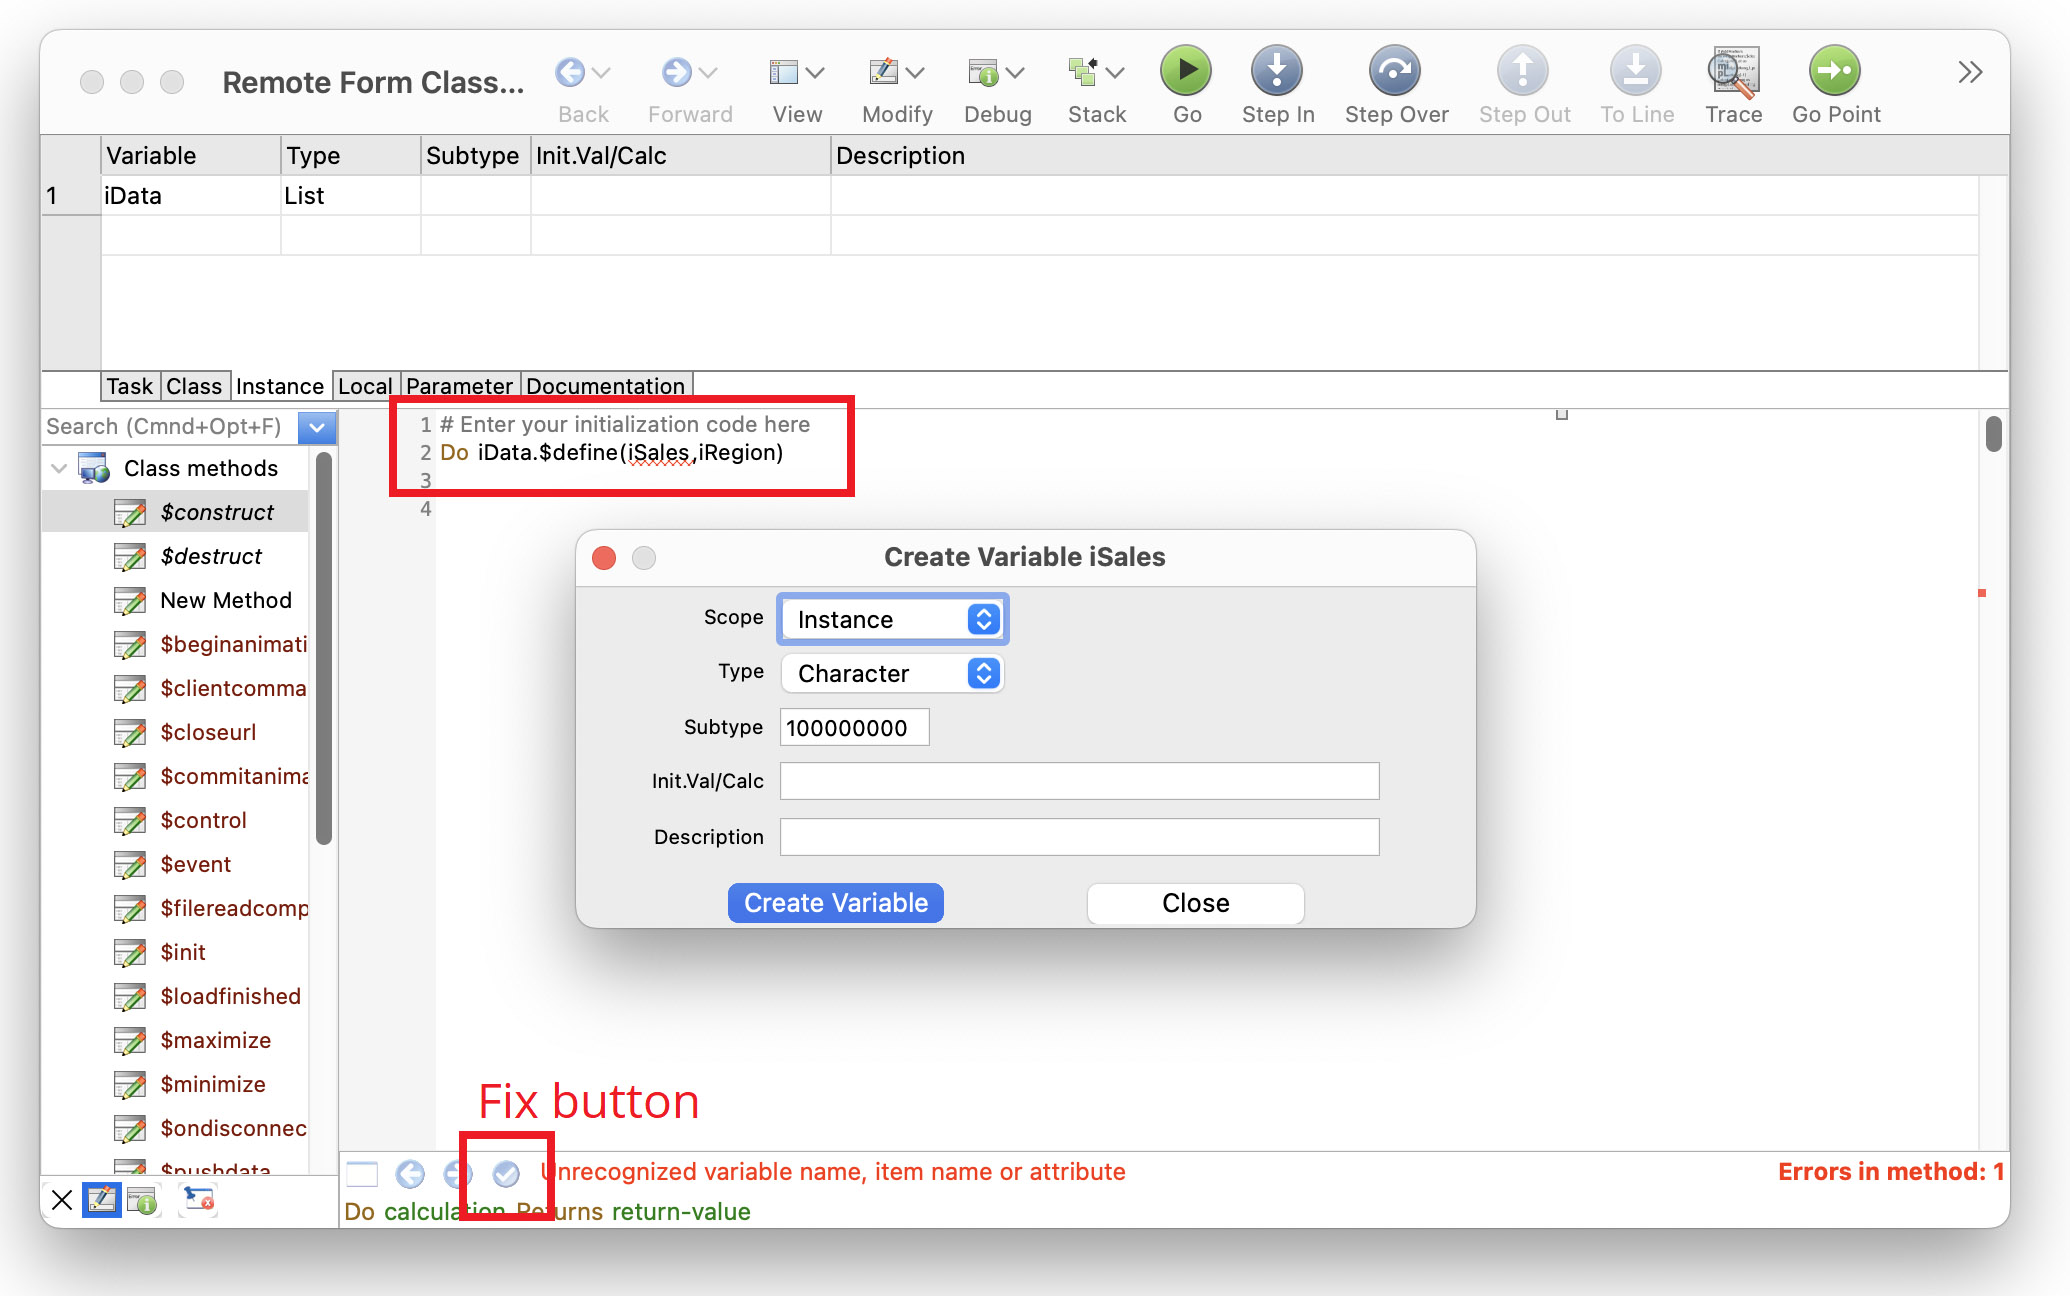
When you have entered all the code (or pasted in the whole method) and created the variables (iSales and iRegion), your method should look like the following, including the instance variables in the Variables pane at the top of the Method Editor (iData was added earlier when you created the Data grid).
Close the Method Editor window and return to the remote form.
Testing a form
At this stage, you may like to test the form to see the data grid containing the data. To test a remote form, you can press Ctrl/Cmnd-T, or right-click on the form background and select the Test Form option. The remote form will open in your default web browser and you will see the data grid containing the sales data: you can edit the data or tab to a new line and enter some new data (but note the data is not saved in this demo). Close the web browser tab and return to the remote form in design mode in Omnis.
Adding a Paged pane
You will be adding a Bar chart and a Pie chart onto the same form, so it would be a good idea to create a layer for each chart, and you can do this using a Paged Pane. Open the Component Store or bring it to the top (press F3/Cmnd-3), drag a Paged Pane component from the Component Store and drop it onto the form just to the right of the Data Grid: you can use the Position Assistance (dotted lines) to align the top edges of the data grid and paged pane controls.
Resize the paged pane to fit the remainder of the form width (on the 768 layout breakpoint view) and set its $height to about 290. Set its $name property to pagepane (replacing the auto generated name), and set $pagecount to 2. To make the paged pane responsive to resizing the form, set the $edgefloat property (on the Appearance tab) to kEFrightBottom.
Adding a Bar chart
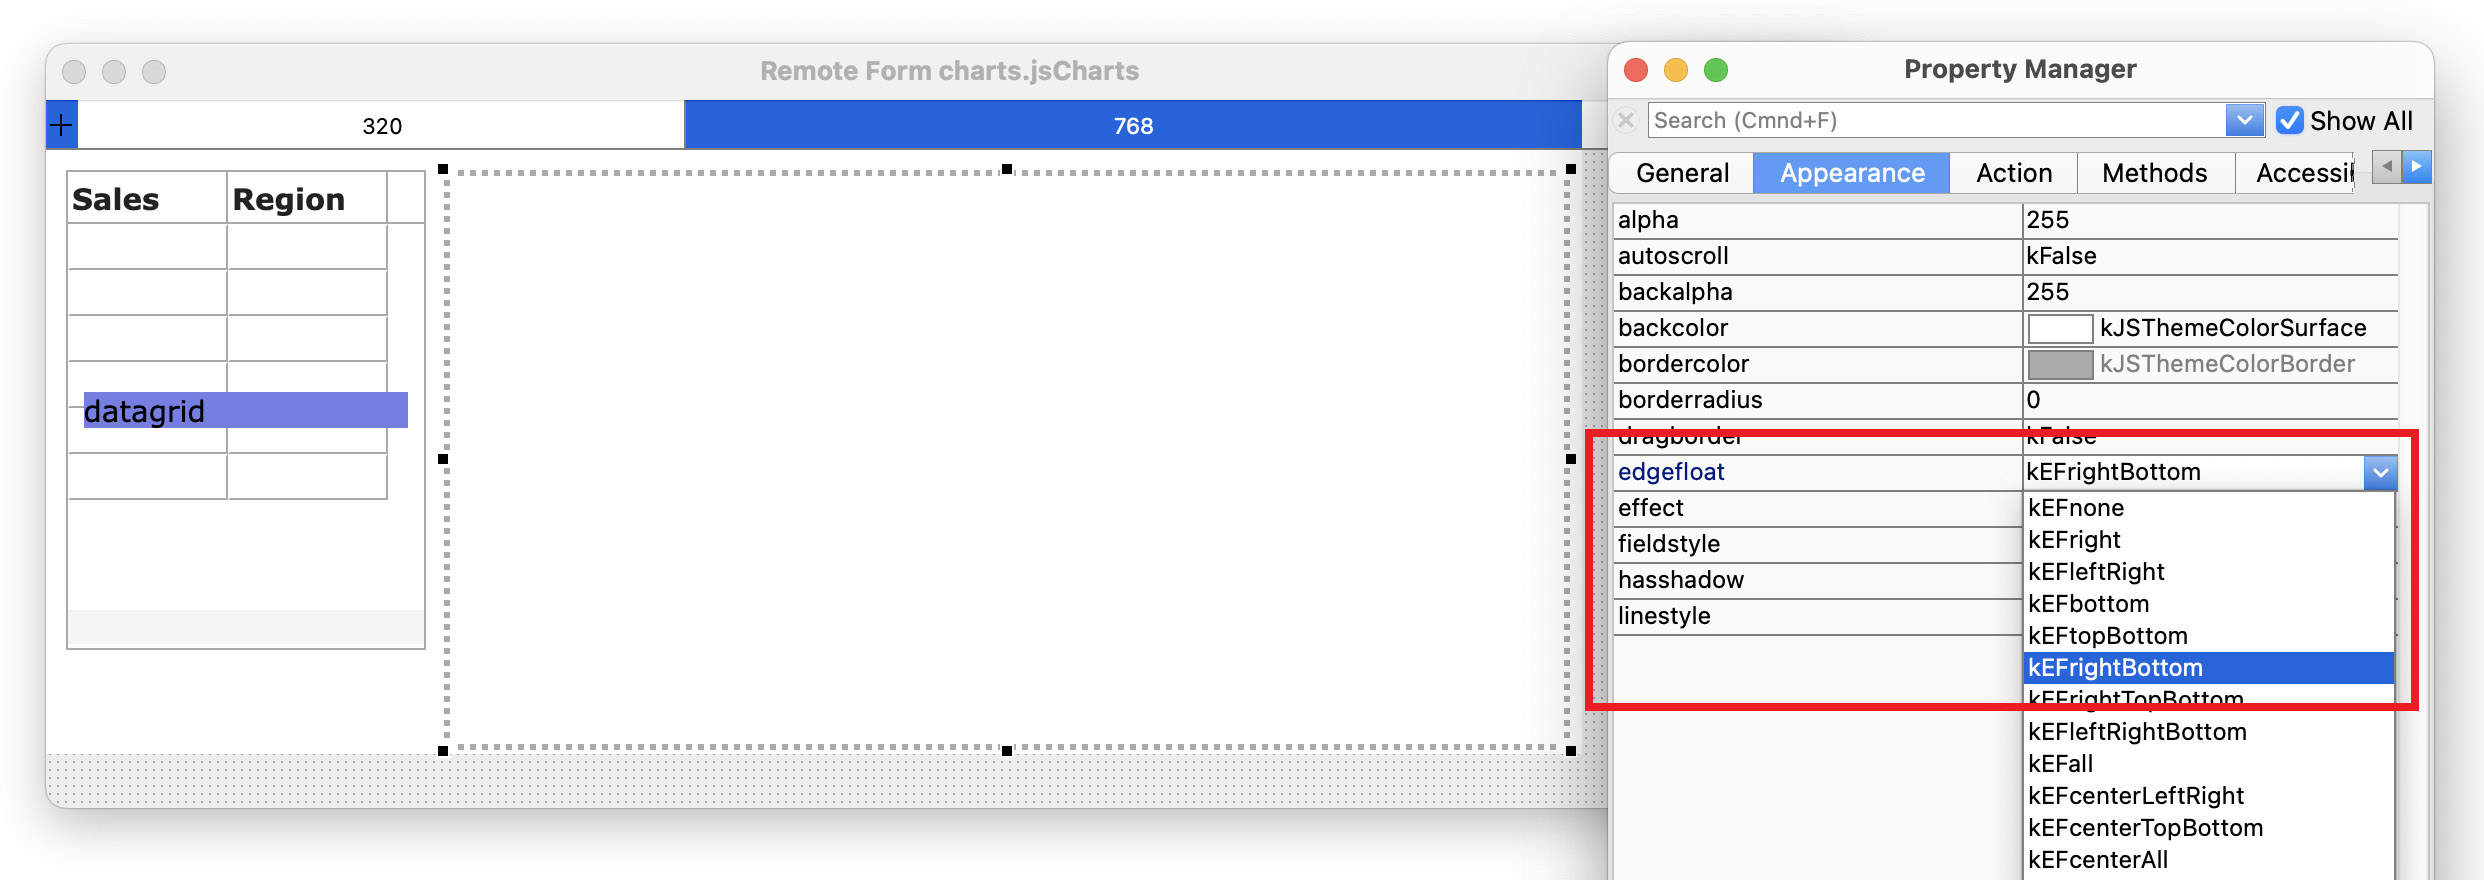
Next drag a BarChart component from the Component Store and drop it inside the paged pane (the paged pane will highlight when you hover the bar chart over it): resize it to fit most of the paged pane, and set the following properties:
$dataname = iData (previously added to the form and essential to link the chart to the data list)
$name = barchart
$edgefloat = kEFrightBottom (on the Appearance tab)
$maintitle = Sales by Region
$ytitle = Sales (1000s)
$showvalue = kTrue (means the value is shown on each bar when tapped or hovered over with the pointer)
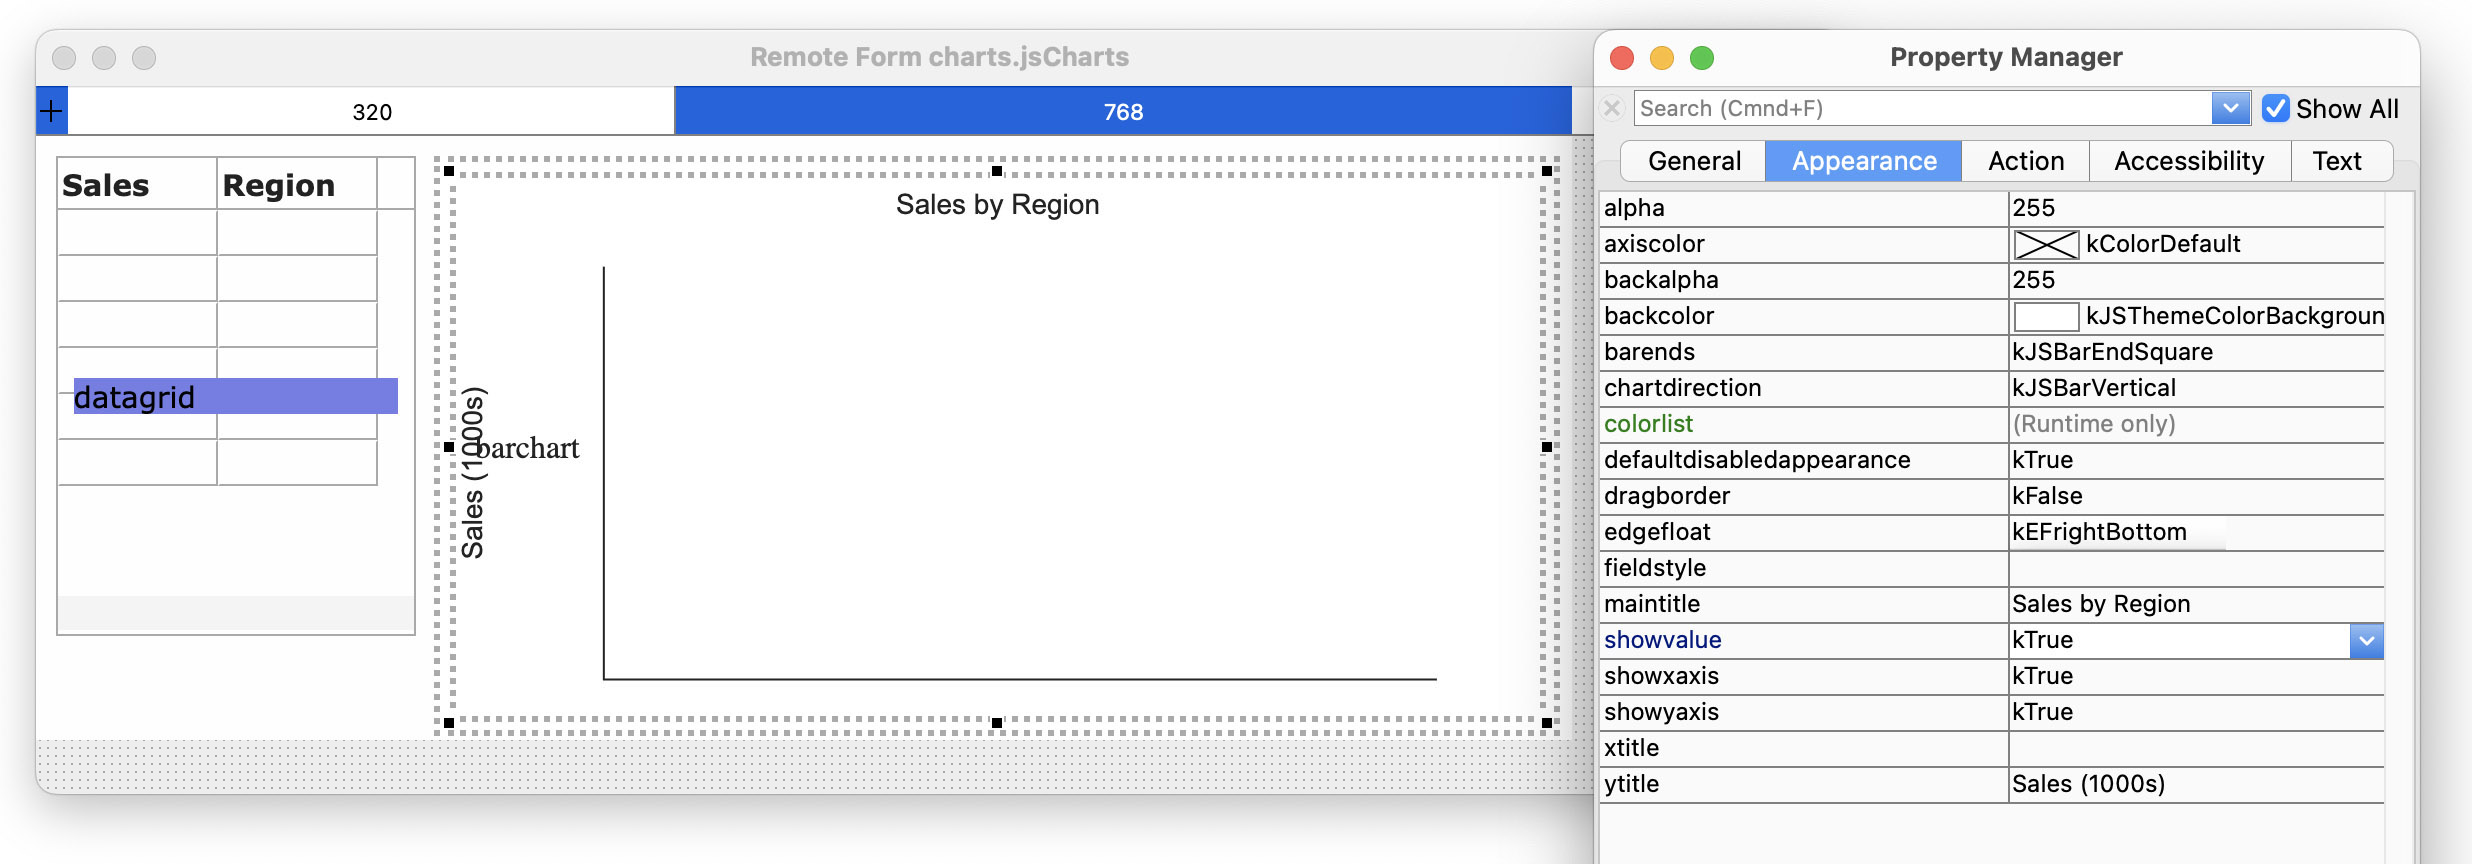
Your remote form should look something like this:
Changing the layout for different breakpoints
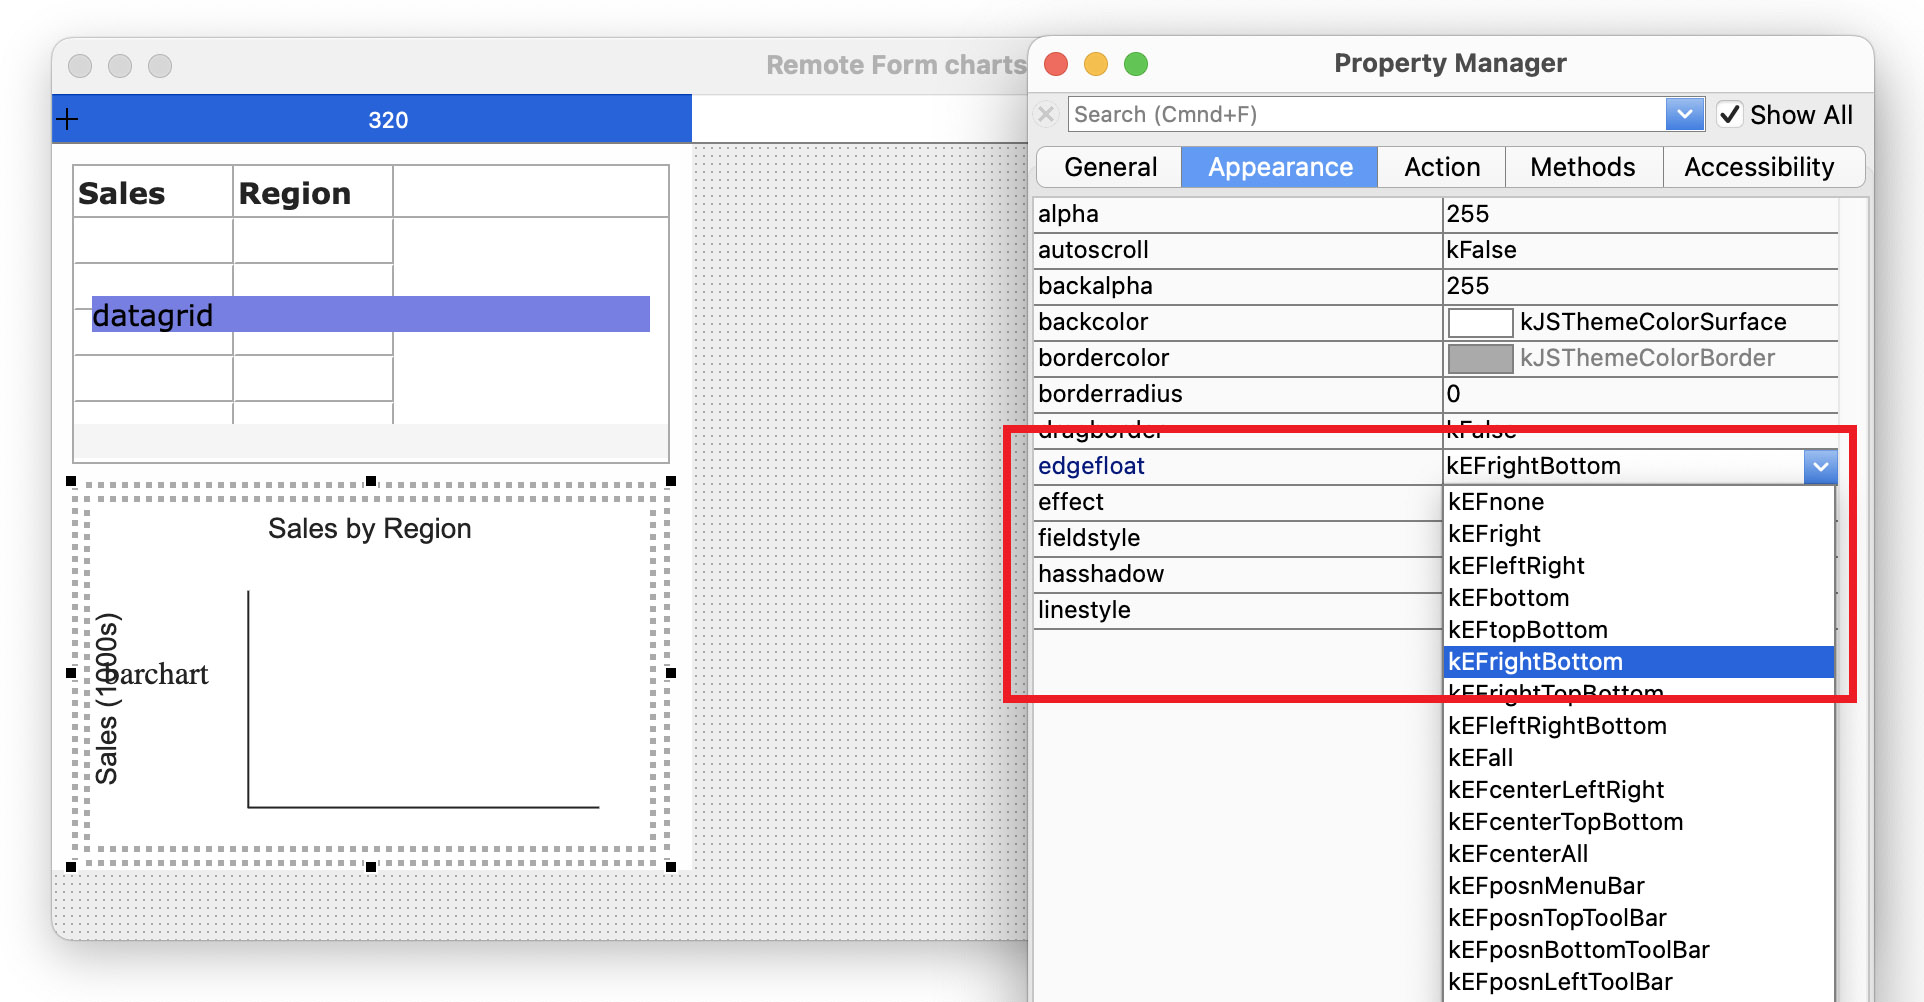
So far you have been designing the 768 layout breakpoint, which is used for desktop browsers, but at this stage you should rearrange the components on the 320 layout breakpoint view, which is displayed on mobile phones or tablets in portrait orientation.
Click on the blue bar marked 320 at the top of the remote form. Move the paged pane down under the data grid, and resize both to fit the width of the form. Resize the bar chart to almost fill the paged pane area. Set $edgefloat for the data grid to kEFright (in this case, you only want the right edge to float or resize), and set $edgefloat to kEFrightBottom for both the paged pane and bar chart components.
You can save the form by clicking on the Save button on the Omnis toolbar (on Windows), or by pressing Ctrl/Cmnd-S, or you can enable to the Auto Save option in the File menu to save every modification automatically.
Test the remote form again by pressing Ctrl/Cmnd-T to open the form in your desktop browser.
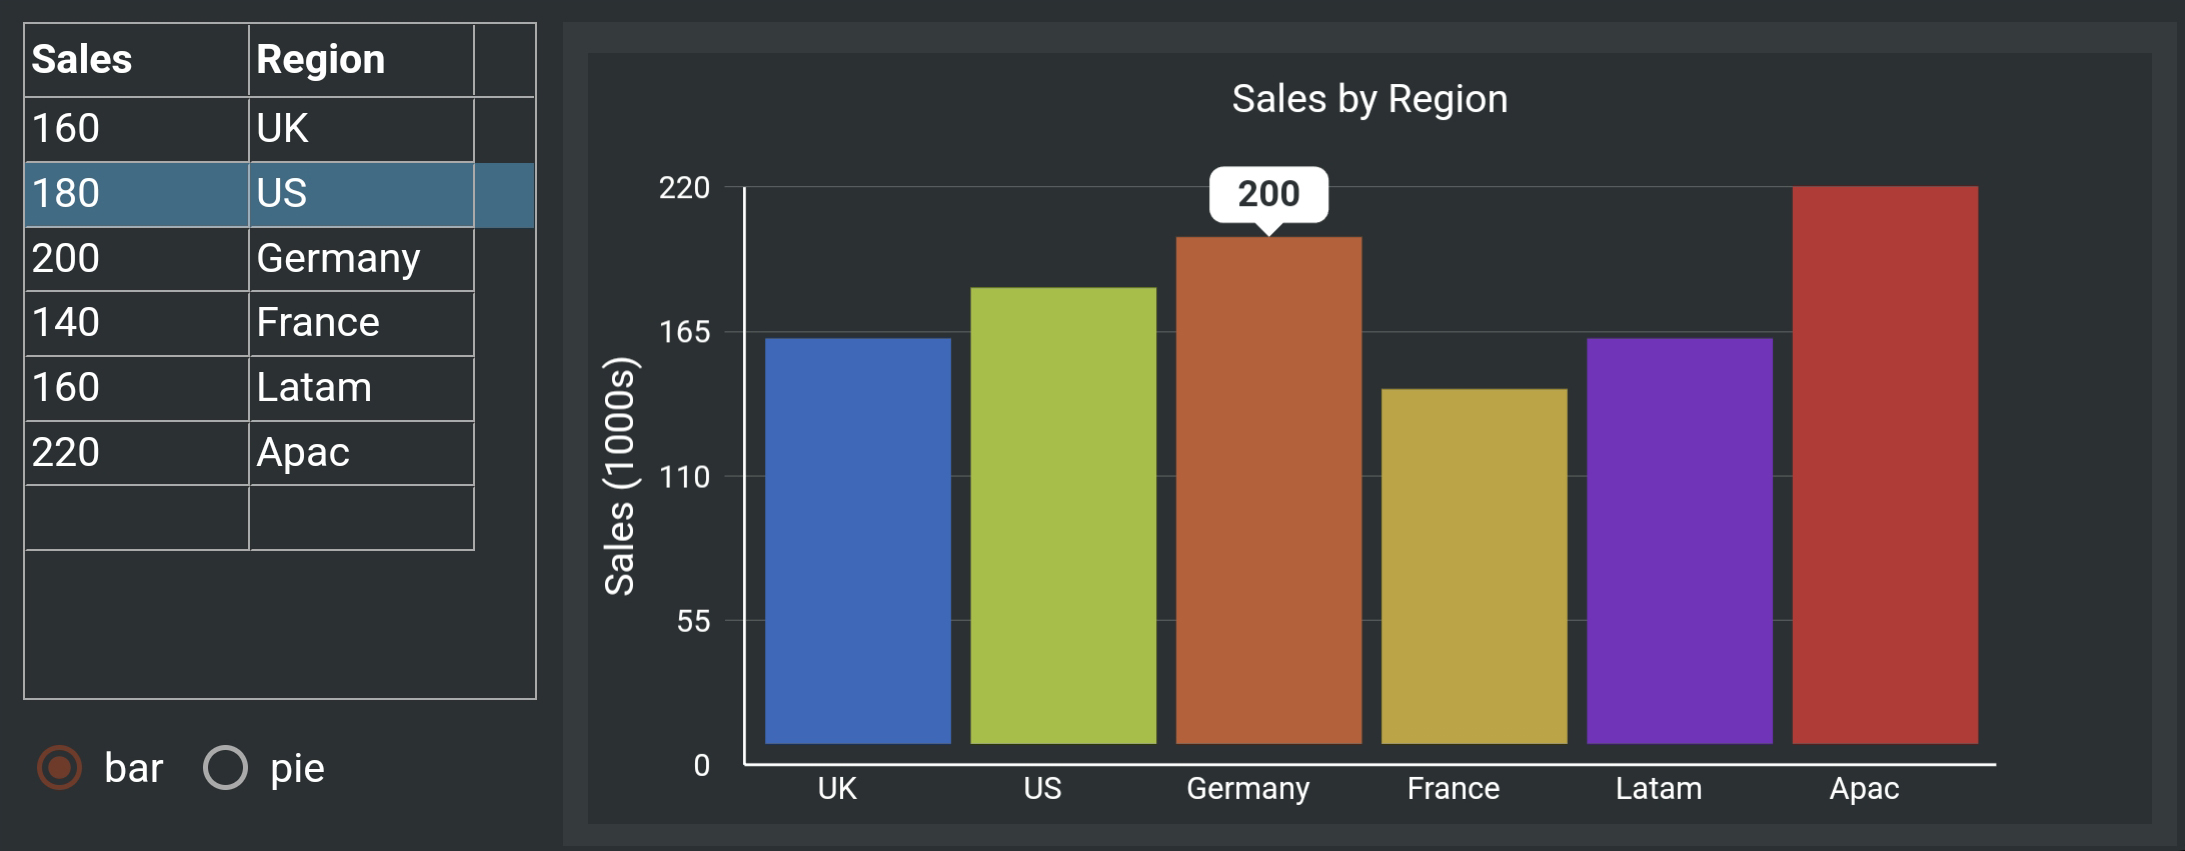
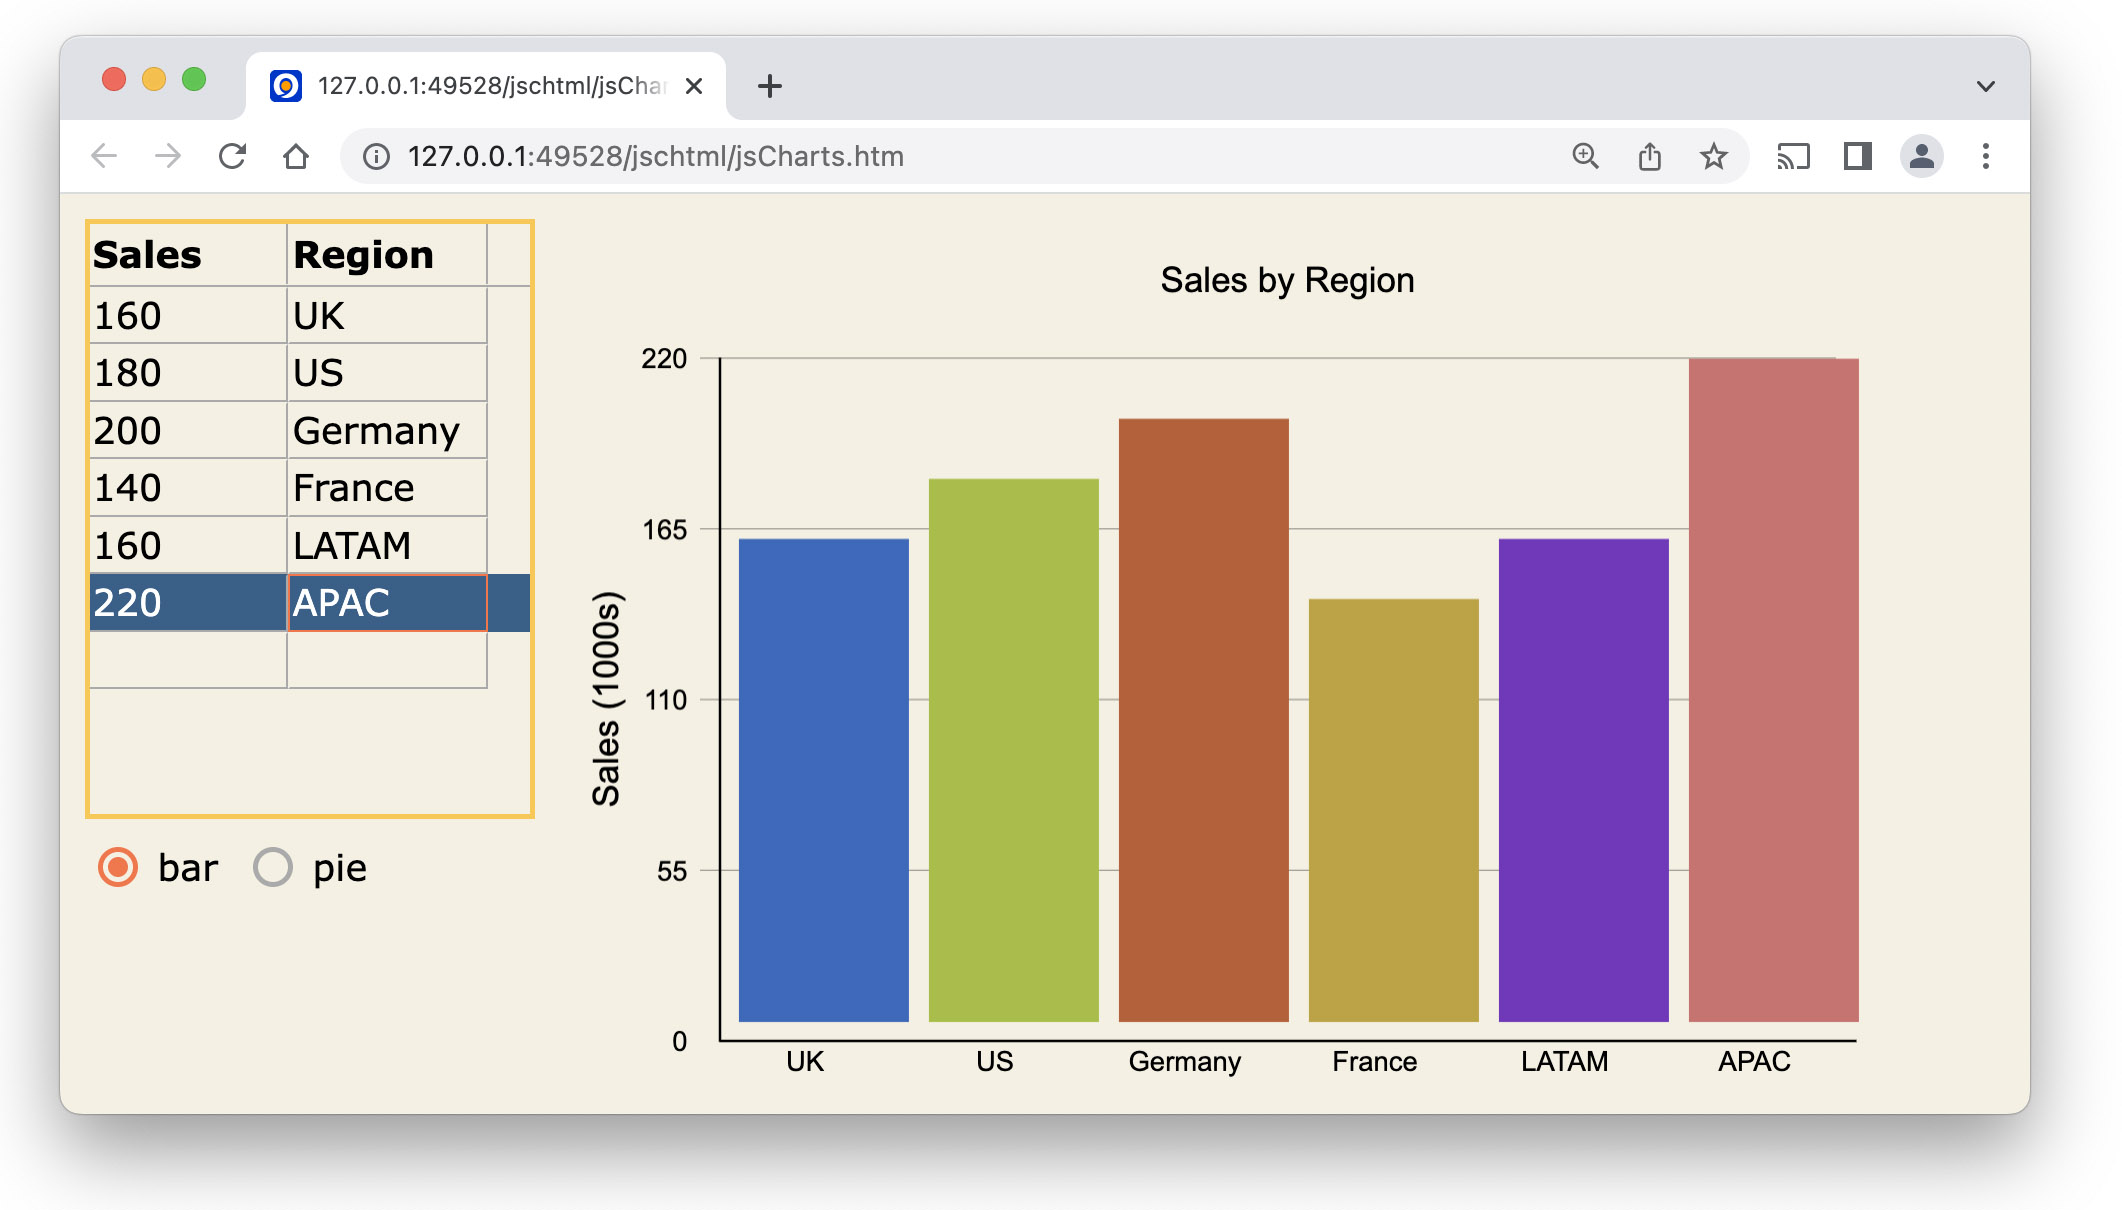
Try resizing your browser window and the components will resize and reposition automatically: if you make the browser narrow, the form will switch to the mobile layout (later on you can test the form on a mobile device). Try changing or adding some data to the grid (e.g. 120 APAC, 180 LATAM) and the bar chart will update automatically. Your form will look something like the following:
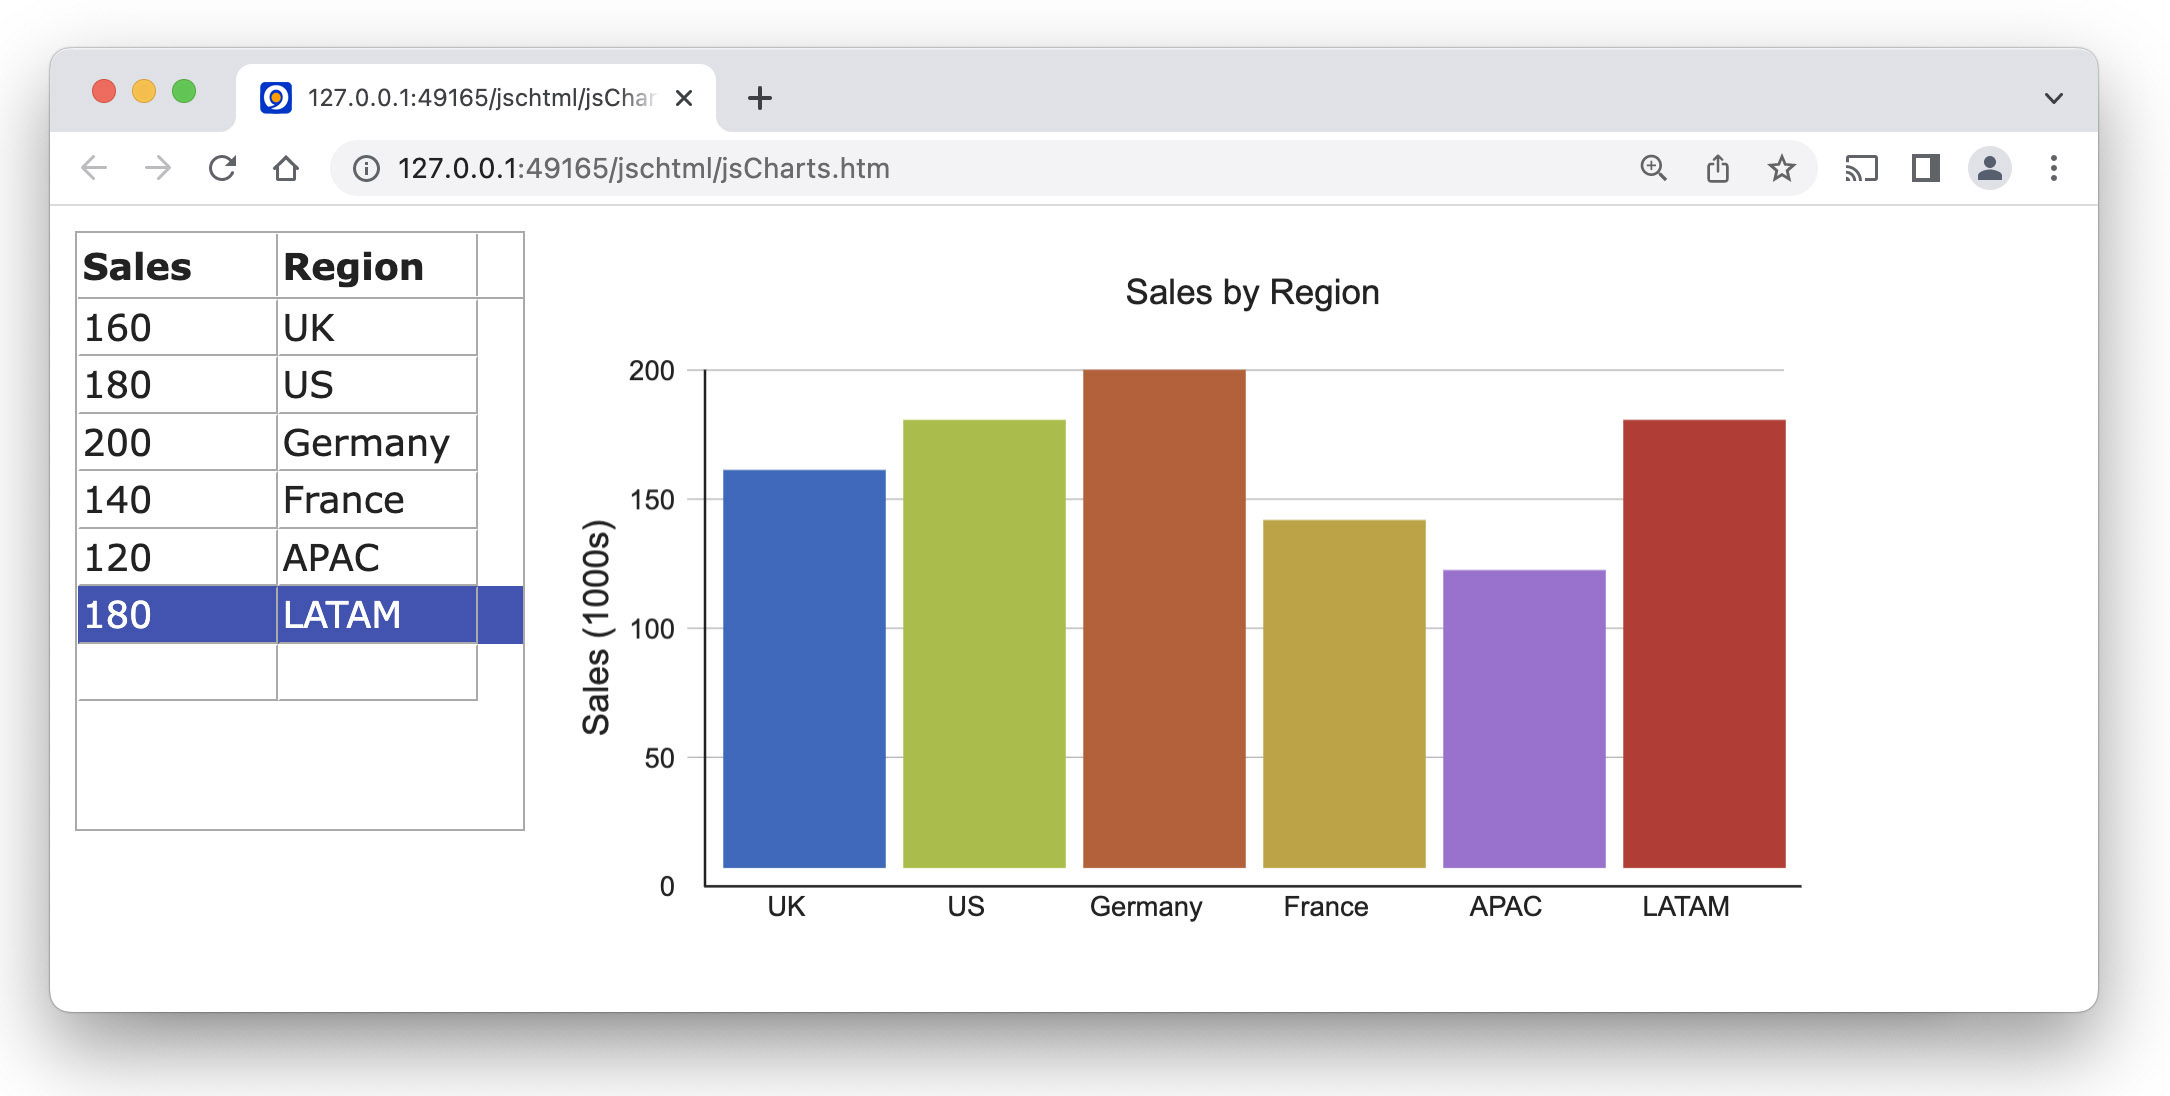
If no data appears, check that you have assigned the iData list variable to the $dataname property of the bar chart. If the bar chart does not resize, check that you have assigned kEFrightBottom to $edgefloat for the bar chart and paged pane for both layout breakpoints.
Close the browser tab and return to the remote form design window in Omnis.
Adding a Pie chart
Next you need to add the Pie chart. Return to the 768 breakpoint view in the remote form, click on the edge of the paged pane to select it (not the bar chart), and set the $currentpage property to 2 (the bar chart will disappear). Drag a PieChart component from the Component Store and drop it inside the paged pane. Resize the pie chart to fit most of the paged pane, then set the following properties:
$dataname = iData (links the chart to the list variable)
$name = pie
$edgefloat = kEFrightBottom (on the Appearance tab)
$maintitle = Sales by Region
$legendnames = kTrue (to ensure the names are shown in the chart legend and not the data values)
$flyout = kTrue (means the pie slice will move out when tapped or hovered over)
Adding a Radio button
Before you can test the form again, you need to add a way to switch between the bar and pie charts contained on the two panes of the paged pane: you can use a radio button as a switch. Drag a RadioGroup control from the Component Store and drop it under the Data grid. Set the following properties:
$name = type
$text = bar,pie
$events = evClick (choose the event from the list)
$minvalue = 1 ($maxvalue should be 2)
$columncount = 2 (on the Appearance tab)
$::horizontal = kTrue
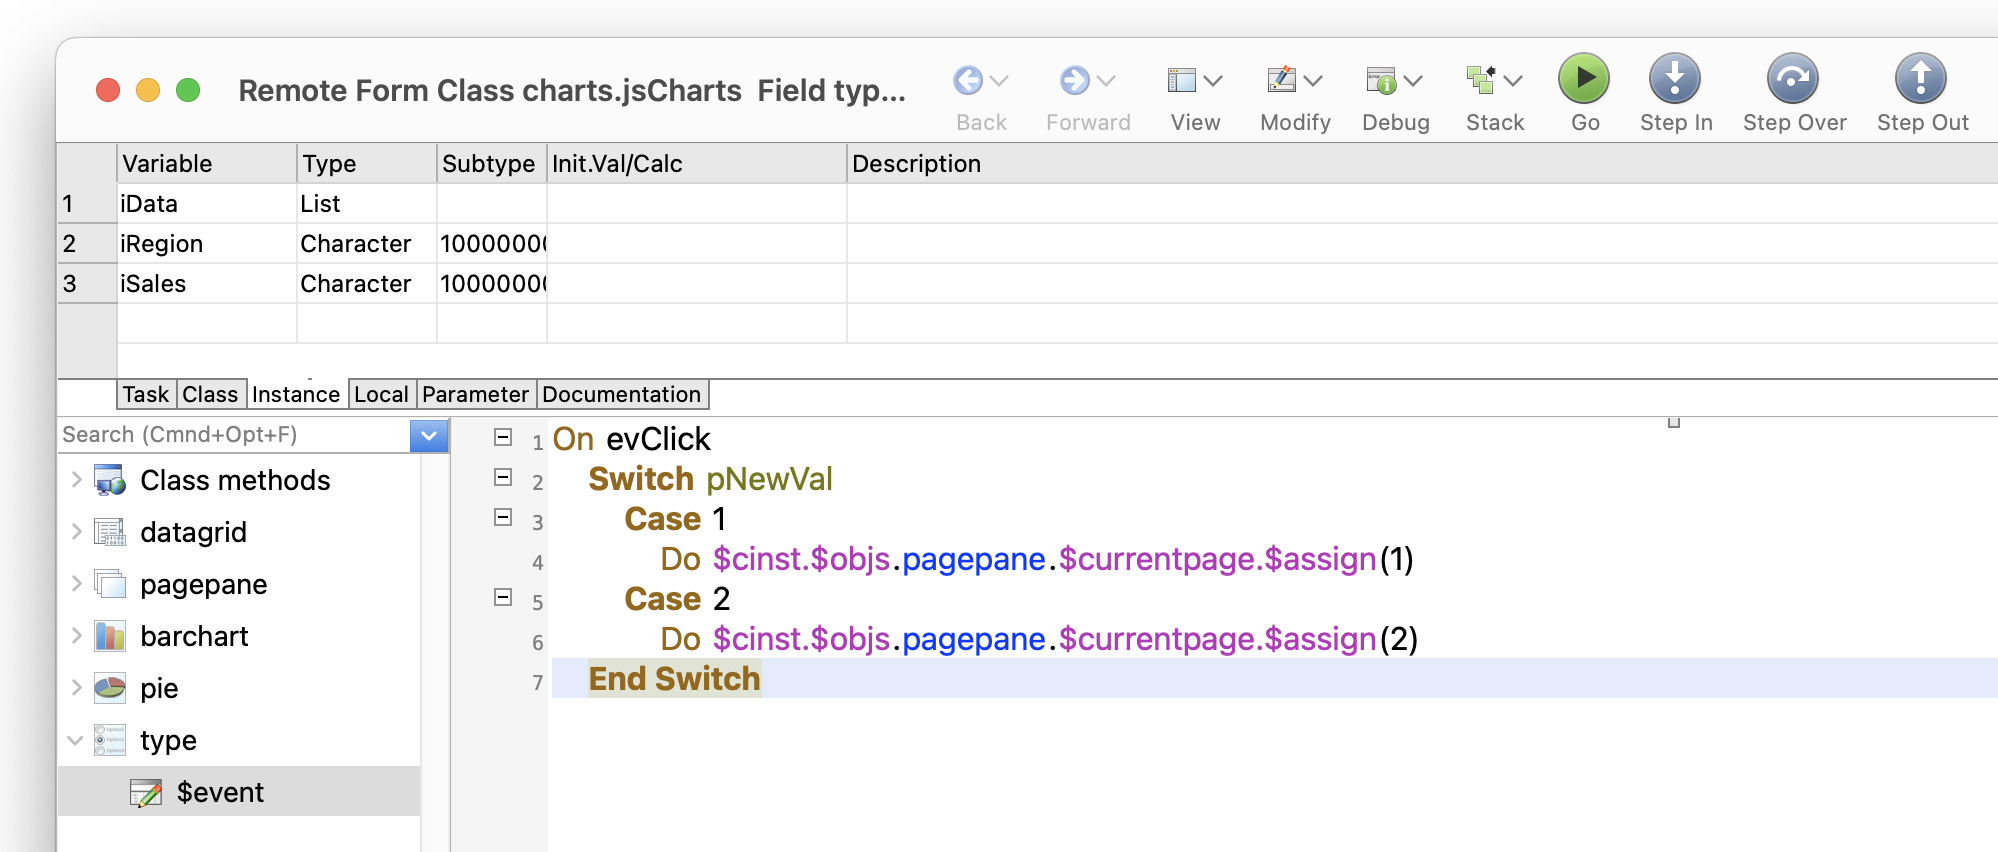
Next you need to add an event method behind the Radio button to switch the paged pane, from bar to pie chart, when the radio button is clicked. To do this, double-click on the Radio button control to open the Method Editor: the $event method for the radio button should be selected. Click into the first empty line and enter the following code (or you can Copy the code from below).
As you type the first letter of each command or parameter Omnis will anticipate what is required, popping up a list of possible items in the Code Assistant: you can select an item from the list using the keyboard or pointer to complete each part of the code line.
The event method for the radio button is:
On evClick |
The complete event method should look like this in the Method Editor. You can use Ctrl/Cmnd-+ to enlarge the text in the code editor.
Close the Method Editor to return to the remote form design window.
You need to sort out the layout for the mobile/portrait layout breakpoint. Click on the 320 bar at the top of the form, move the paged pane down and make sure its $edgefloat property is set to kEFrightBottom. Resize the pie chart control to fit just inside the paged pane, and also set its $edgefloat to kEFrightBottom ($currentpage of the paged pane needs to be set to 2 to see the pie chart). Next move the radio button into the gap under the data grid (see below): resize the radio button if necessary to fit the gap (e.g. reduce its $height to 30). Press Ctrl/Cmnd-S to save the form. The 320 layout breakpoint on your remote form should look something like the following:
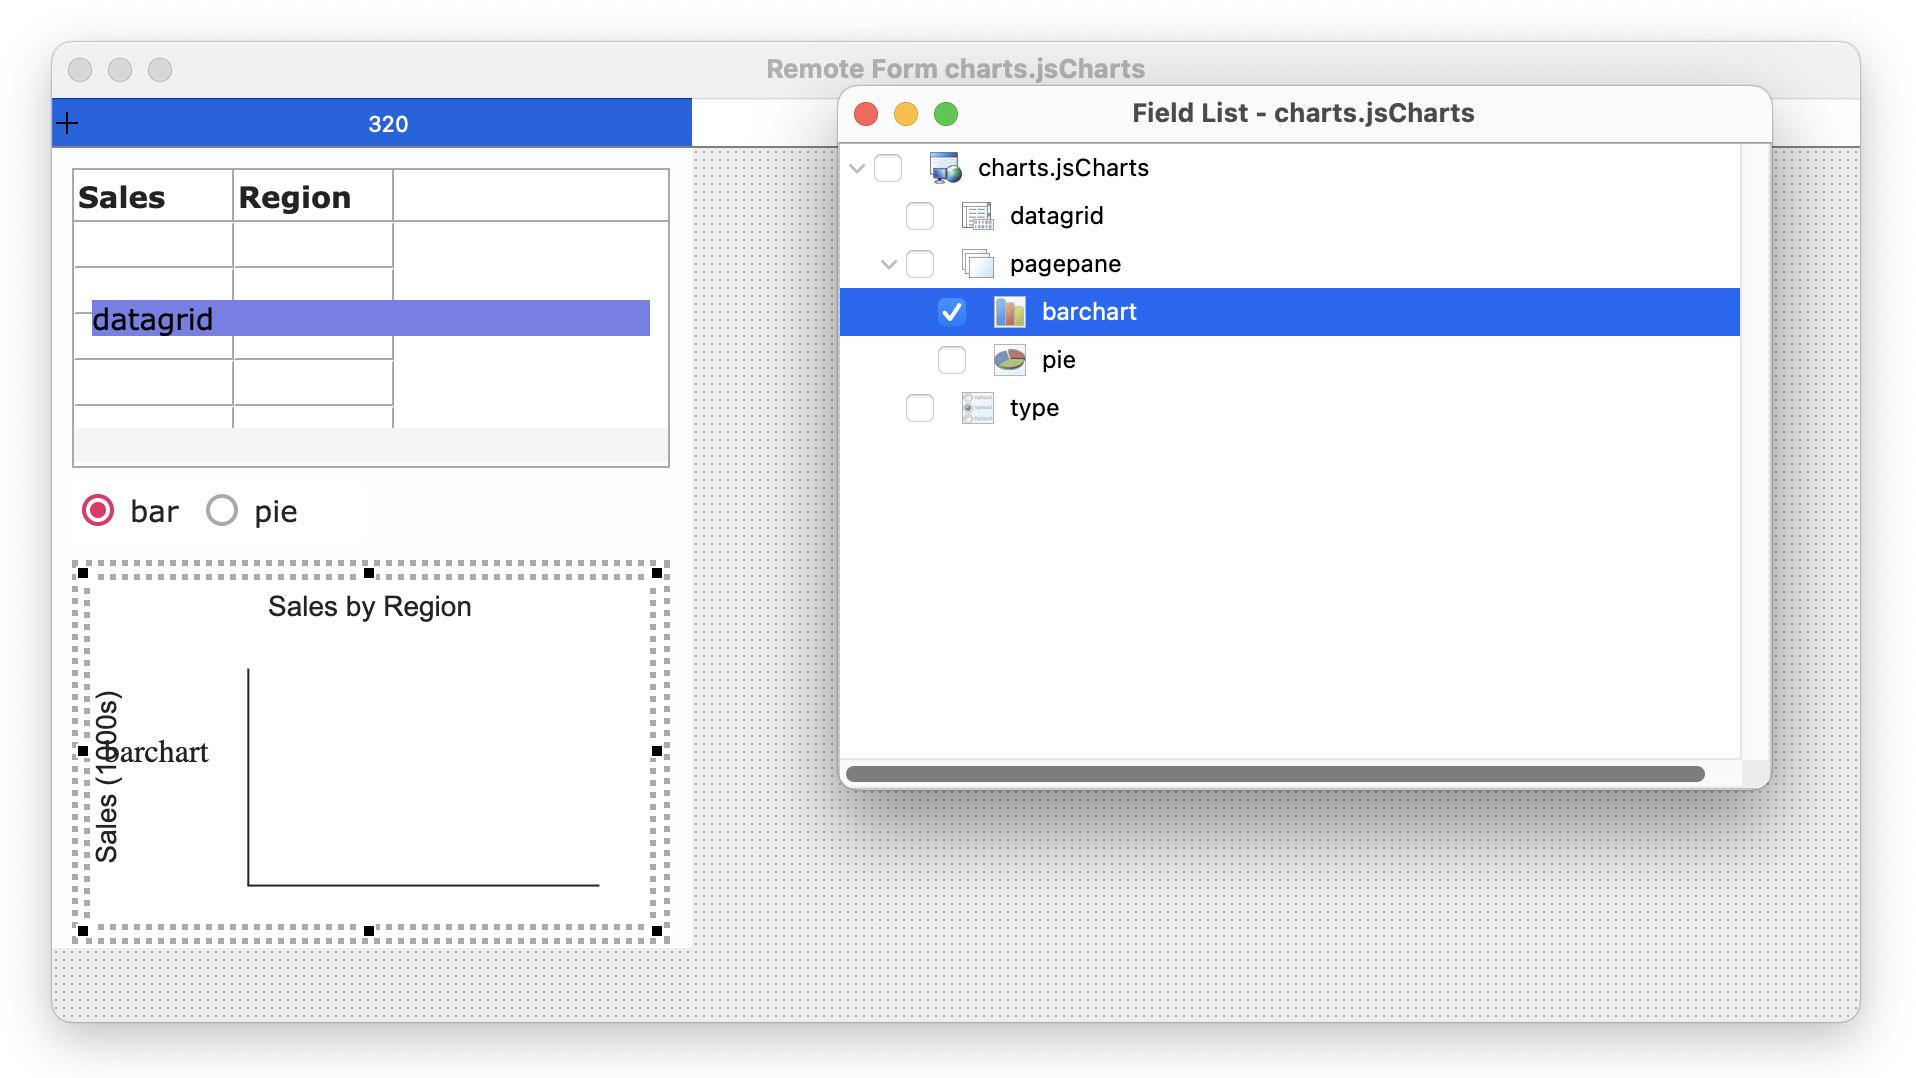
If you need to make further changes to the bar chart, on the first pane of the paged pane, you need to set the $currentpage property back to 1 to show the bar chart. If you find the Paged pane or charts difficult to select, you can use the Field List (see above): right-click on the background of the remote form, select the Field List... option, open the node for ‘pagepane’ and select ‘barchart’ or ‘pie’ to select them in the form, and the paged pane will be switched automatically.
Testing the form again
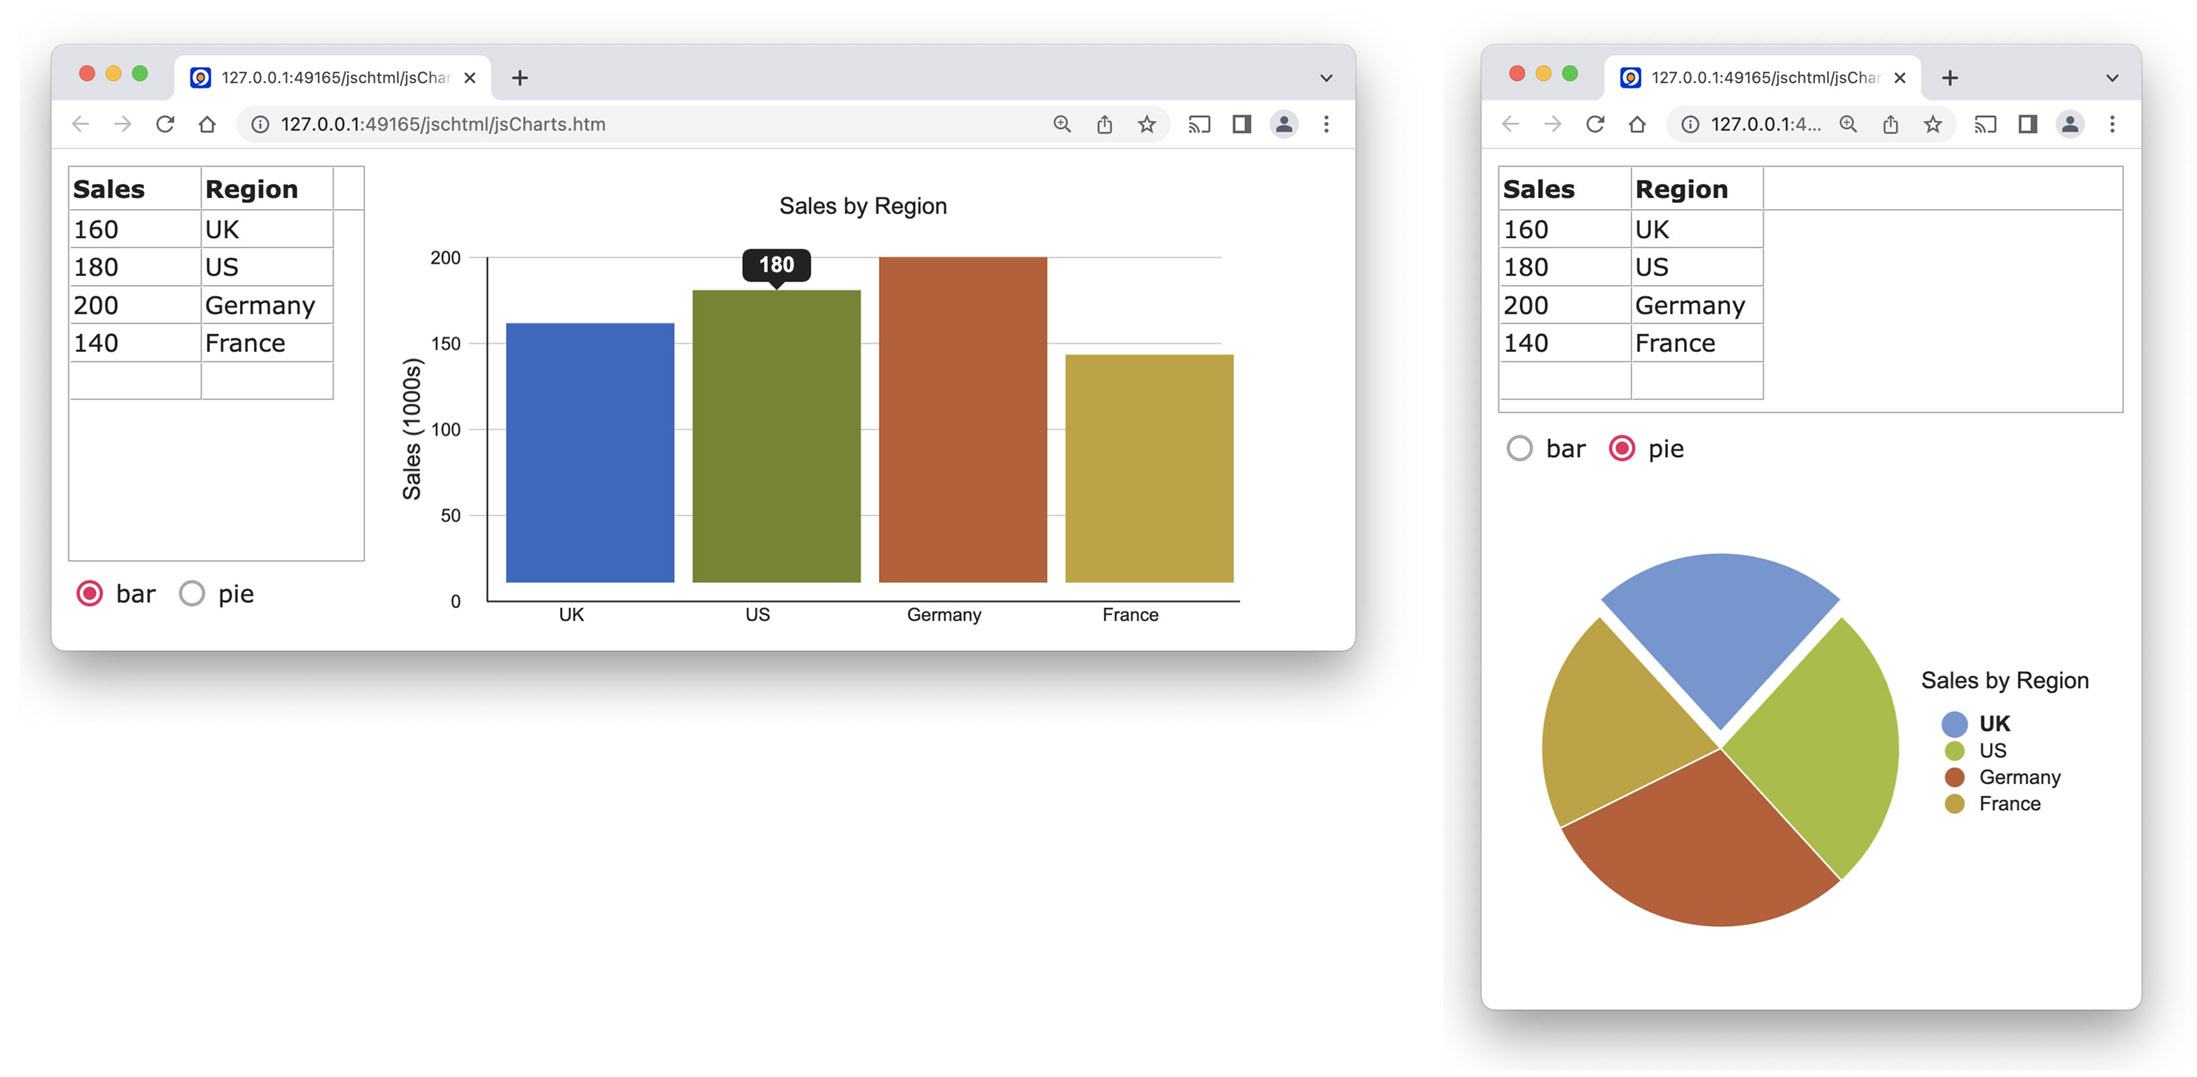
Now you can test the form again by pressing Ctrl/Cmnd-T. Initially you will see the bar chart, but you can click on the Radio button to switch to the Pie chart showing the same data. For data visualization, it’s good to display the same data in different formats, in this case, either specific amounts in the bar chart, or as a percentage of the whole data set in the pie chart.
Experiment by adding some data, try switching between bar and pie, and resizing your browser window to compare the layouts: note how the components resize and reposition automatically, and float smoothly between the different layouts (since $animatelayouttransitions of the remote form is kTrue).
Now your demo form is complete you might like to view it using a different theme. Back in design mode in Omnis, press Ctrl/Cmnd-J to open the JavaScript Theme selector and select a theme, e.g. the following shows the ‘vintage’ theme. Use Ctrl/Cmnd-T to test the form.
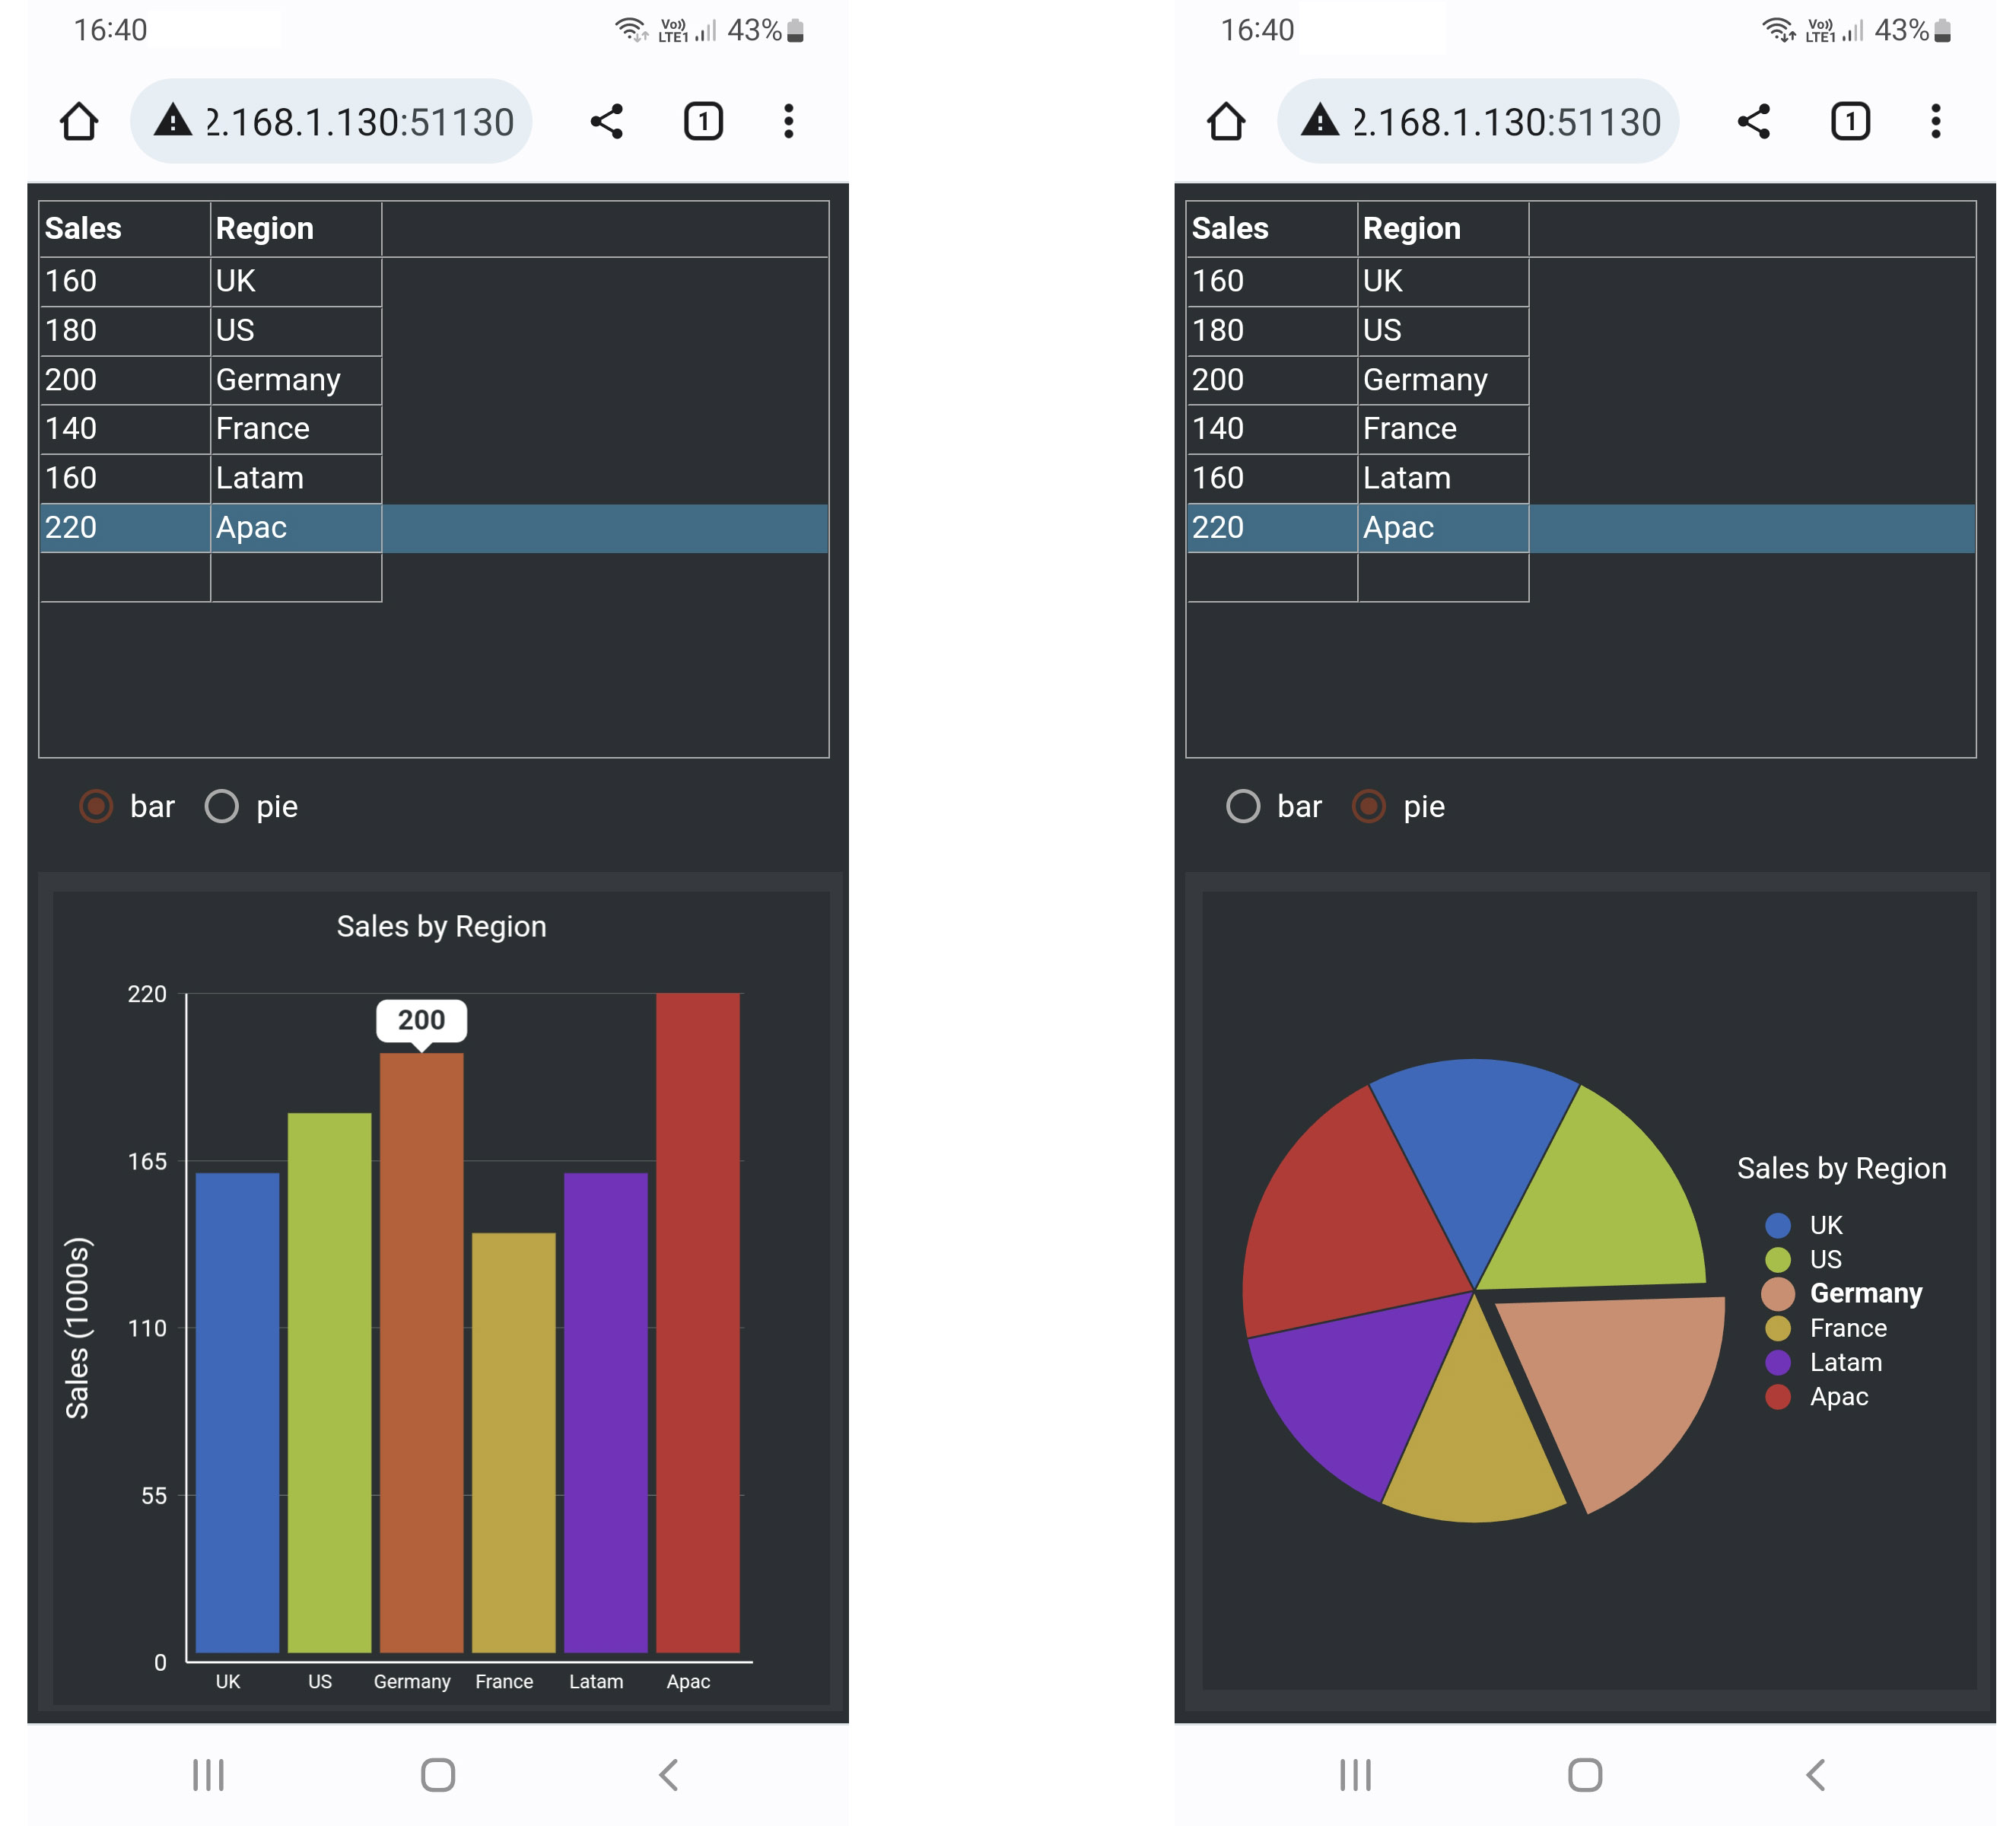
You can test your form on a mobile phone or tablet by following the instructions at the end of this tech note (substituting your own ip address, portnumber and remote form name). The following shows the two views on a phone, using the Professional JS theme:
The color of the bars and segments in the charts are set automatically, but you can use the $colorlist property to specify the colors to be used: this is a runtime only property which must be set in the client, such as in the $init method of the remote form which runs after the form has been constructed on the client. In addition, you can detect when an individual bar or pie segment is clicked by trapping the evBarClicked and evSegmentClicked events, respectively. To explore more properties and the events of Bar and Pie charts, you can view the JS Bar Chart and JS Pie Chart samples in the Hub in the Studio Browser and examine their code, or look in the online docs for Bar and Pie chart controls.

 Facebook
 Github
 Instagram
 Linkedin
 Twitter
 Youtube
 Please logon or create a free account to download this file.
